S&P 500 Outlook: Rip Higher or Drop Lower?

Ultima Markets provides a comprehensive breakdown of the S&P 500 in this analysis dated November 14, 2025.
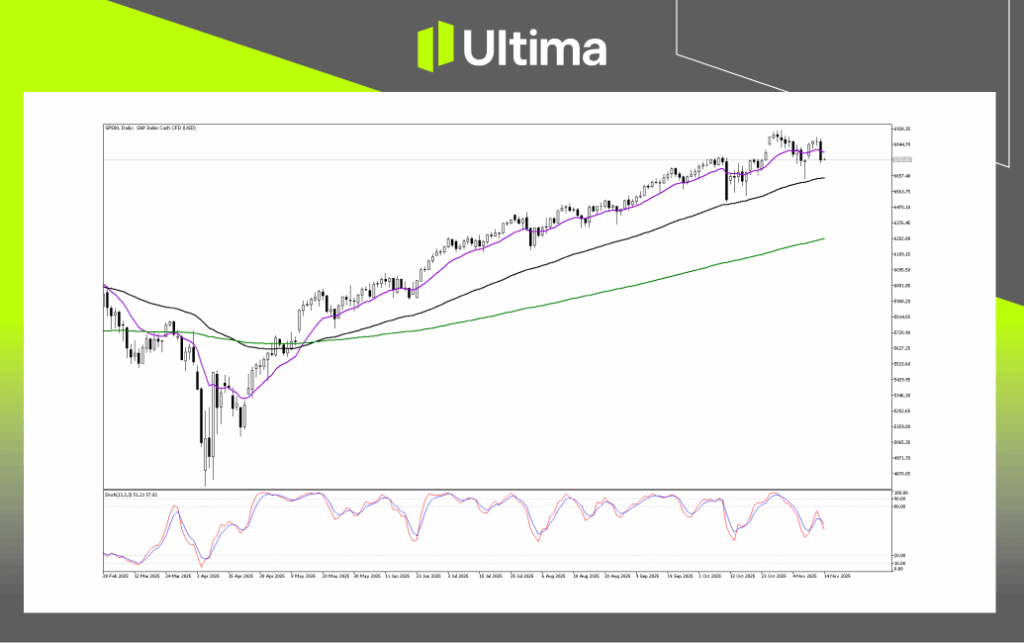
Is the S&P 500 Done Rallying? Although the broader trend is still pointed upward, near-term strength is tapering off. After reaching record highs around 6,938, the price has slipped and is now interacting with dynamic support zones.
The Stochastic indicator in the lower panel has turned down from the overbought region above 80 and is sitting in the mid-range near 51–57, signaling that the strong buying wave has eased and the market is working through a normal pullback or profit-taking phase.
In terms of momentum, the distance between current price levels and the long-term green moving average is unusually large. This kind of stretch often resolves through a period of sideways movement or a return toward the mean, giving the moving averages time to realign with price before the next directional push.
Key Levels
The price is hovering around the short-term moving average (purple), roughly 6,750–6,760, which acts as the first layer of support. A daily close beneath this zone would indicate weakening conditions.
More significant support is found near 6,560–6,600, in line with the medium-term moving average (black). In previous instances, such as in June and August, price reacted strongly from this area.
The long-term moving average (green), around 6,280, represents the base of the trend. A decline toward this level would imply a substantial correction, though such a move appears unlikely in the near term.
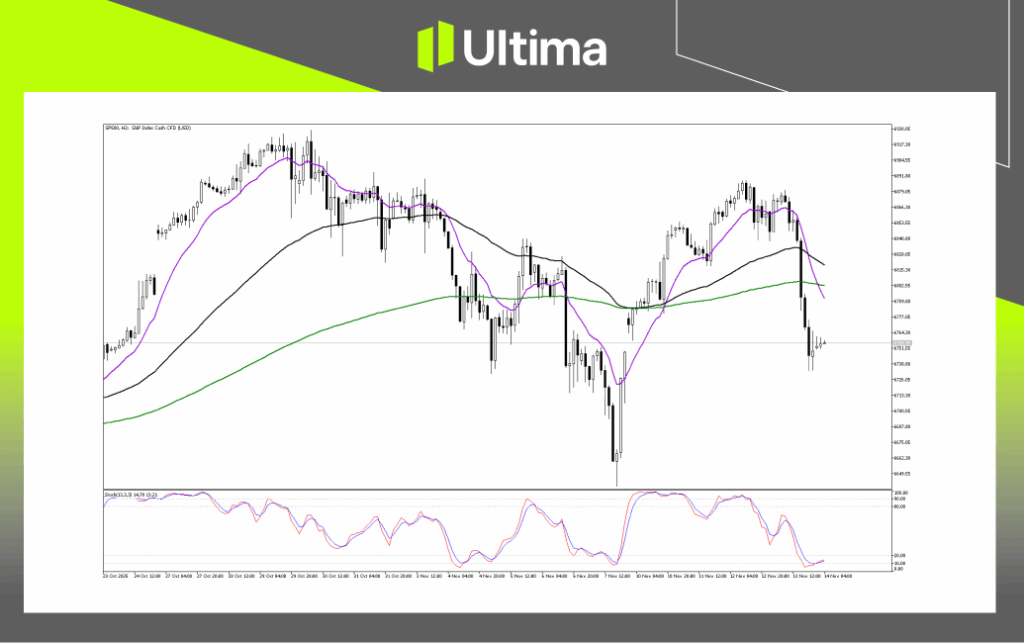
S&P 500 Coils for a Big 2-Hour Move The market is sitting at a delicate juncture. Even though the broader trend has shifted to the downside, the deeply oversold readings suggest that a rebound is increasingly likely. Traders should pay close attention to support near 6,725 and the resistance band between 6,800 and 6,815, as these levels will help dictate the next meaningful move.
Breakout Scenarios
Bearish continuation: If price breaks below 6,725 and holds there with a confirmed 2-hour close, it would signal that sellers still dominate and that the recent pause is only temporary. In that case, the next downside objective would likely be the key support zone around 6,660.
Bullish Setup
Given how oversold the market is, an upward reaction is very plausible. The earliest sign of buyers regaining control would be a move back above 6,780. For a genuine bullish breakout, price would need to clear and close above the cluster of moving averages at 6,800–6,815. A confirmed move above this ceiling would indicate that the steep drop was simply a corrective phase and could open the door for a push toward the next resistance near 6,850.
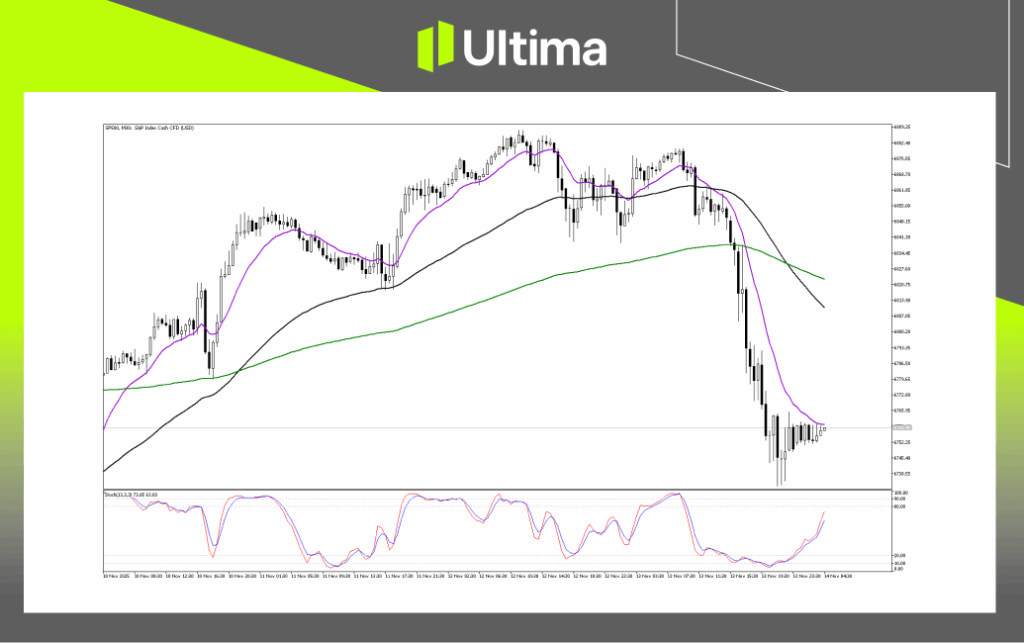
Calm Before a Potential Market Whiplash After the steep decline, price movement has slowed and compressed into a very narrow consolidation zone. This sideways behavior shows that buyers and sellers have reached a temporary balance as the market absorbs the prior sharp move.
Bullish Breakout (Relief Rally)
A short-term rebound would be suggested by a strong 30-minute close above the nearby resistance and the purple moving average around 6,770. Clearing this barrier could spark a wave of short covering, with initial upside objectives at 6,790–6,800 and a more substantial target in the 6,810–6,830 resistance band. The upward tilt in the Stochastic indicator adds credibility to this potential scenario.
Bearish Breakdown (Trend Continuation)
A continuation of the downtrend would be indicated if price closes below the key support at 6,738 on a 30-minute basis. Such a move would imply that the current sideways action was simply a bear flag, a brief pause before further selling. A confirmed breakdown would diminish the likelihood of a rebound and shift focus toward lower psychological levels near 6,720 and 6,700.
Navigating the Forex Market with Ultima Markets
Successfully navigating today’s financial markets requires staying informed and making well-reasoned, data-driven decisions. As a leading provider of market insights, Ultima Markets is committed to equipping you with the information and tools needed to trade with confidence. For guidance tailored to your individual financial goals, our team is always ready to assist.
If you trade major indices, such as the S&P 500, one of the most widely followed stock market indices in the world, Ultima Markets offers a robust environment designed to support informed index trading.
By joining Ultima Markets, you gain access to a complete trading ecosystem, along with educational resources from the UM Academy, helping you build the skills necessary to excel in global markets.
Stay connected for more expert analysis and market updates from the Ultima Markets team.
—–
Legal Documents
Trading leveraged derivative products carries a high level of risk and may not be suitable for all investors. Leverage can magnify both gains and losses, potentially resulting in rapid and substantial capital loss. Before trading, carefully assess your investment objectives, level of experience, and risk tolerance. If you are uncertain, seek advice from a licensed financial adviser. Leveraged products are not intended for inexperienced investors who do not fully understand the risks or who are unable to bear the possibility of significant losses.
Copyright © 2025 Ultima Markets Ltd. All rights reserved.
Disclaimer
Comments, news, research, analysis, price, and all information contained in the article only serve as general information for readers and do not suggest any advice. Ultima Markets has taken reasonable measures to provide up-to-date information, but cannot guarantee accuracy, and may modify without notice. Ultima Markets will not be responsible for any loss incurred due to the application of the information provided.


