LUX (de MarcellusLux)
| Gain : | +33148.17% |
| Drawdown | 13.78% |
| Pips: | 16679.7 |
| Transactions | 558 |
| Gagné: |
|
| Perdu: |
|
| Type: | Réel |
| Levier: | 1:500 |
| Trading: | Inconnu |
Edit Your Comment
Discussion LUX
Membre depuis May 19, 2020
posts 321
Jul 06, 2023 at 10:25
Membre depuis May 19, 2020
posts 321
@DenverRRR @WhiteWitcher
Great discussion, I would be glad to share my opinion:
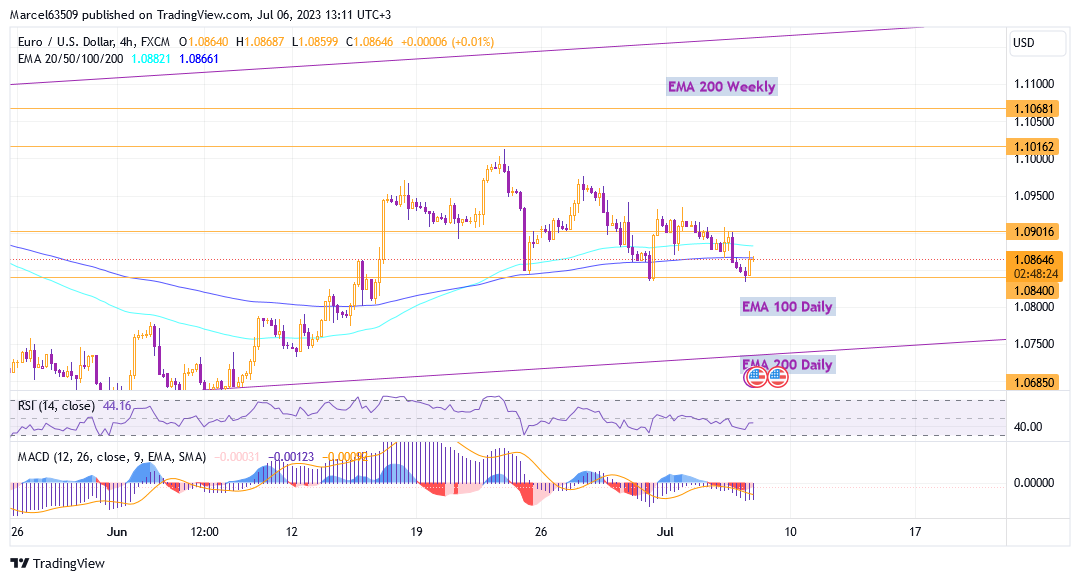
EUR/USD is trying to break below 1.08400 for the third time, which gives reason to consider this level as a key support and the main marker level to determine further fall to EMA 100 and EMA 200 on the daily chart, which are now at 1.08100 and 1.07250. At the same time, the price did cross the EMA lines on the hourly and four-hour charts, and this is the initial sell signal. The MACD on the 4 hour chart provided a very slight divergence which I would not consider a significant buy argument. It is likely that a long-term uptrend is forming on the daily chart at the moment and a further fall as a correction within the channel is a very likely option.
In the short term, I see the hourly MACD giving a buy signal, which could be the start of a rise towards the 200 EMA and 100 EMA on the hourly chart, which are in the 1.08900 and 1.09000 resistance area. In the near future, testing of these levels is possible, but I find further growth unlikely. However, I will keep an eye on the marker level 1.09000, because its break could lead the market to a bullish option, at least with the prospect of 1.09400 and 1.09750.

@Marcellus8610
Membre depuis May 19, 2020
posts 321
Jul 07, 2023 at 15:02
Membre depuis May 19, 2020
posts 321
fire_kid posted:
looks promising. i have added fund. i think it will be added on next week. got this message
Current Period:
2023-06-22 01:00 -- 2023-07-06 01:00
Thank you for joining, let's be in touch
In case any questions arise contact [email protected]
@Marcellus8610
Membre depuis May 19, 2020
posts 321
Jul 13, 2023 at 09:12
Membre depuis May 19, 2020
posts 321
ChaKie posted:MarcellusLux posted:ChaKie posted:
@MarcellusLux How's your trading going this week? I'm thinking about to trade on the euro tomorrow, expecting good volatility.
Trading was not so active, I did not enter the market during the increased instability. At the moment, the EUR/USD has gone far above1.09000. As you can see, my sell forecast was incorrect and my assumption that 1.09400 and 1.09750 will be reached in case of breaking through the 1.09000, is now being fulfilled.
07.03.2023 I closed a profitable trade on usd/jpy, which provided a gain of 1.55%.
How about your trading?
Well, mate, my trading didn't go as planned. Started on the right direction, but then boom! Price went against me. After the stop loss, I immediately opened trade in the opposite direction. And guess what? The price went against me again. I decided to fix a small loss. Looking at the chart know I see that I made the right choice.
Drama in 6 minutes or how to lose $ 1800 very quickly on the screenshot. Don't do like me :)
Thanks for sharing your experience, it's a great way to learn. This is a valuable lesson for everyone and a very significant example of the fact that it is wrong way to run after the market, you need to know where it will be and wait for it there with a take profit.
As I said before, I didn't trade the EUR/USD during the days of high activity, but you guys @DenverRRR @ChaKie are very brave.
@Marcellus8610
Membre depuis Jul 25, 2023
posts 1
Membre depuis May 19, 2020
posts 321
Jul 28, 2023 at 09:11
Membre depuis May 19, 2020
posts 321
redtrader556 posted:
Is there any way for US investors to participate?
I have no options to offer US investors for now, but we can be in touch [email protected]
@Marcellus8610
Jul 31, 2023 at 11:16
Membre depuis Oct 18, 2021
posts 60
@MarcellusLux Dude I look forward to your analysis on EURUSD. I`m sure the market can surprise us today on the last day of the month.
Aug 04, 2023 at 09:06
Membre depuis Sep 29, 2022
posts 68
@MarcellusLux Do you provide a signals?
Subscribed to you.
Subscribed to you.
Membre depuis Aug 16, 2022
posts 9
Membre depuis May 19, 2020
posts 321
Aug 08, 2023 at 09:19
Membre depuis May 19, 2020
posts 321
Patrick2018 posted:
How can I get your strategy
I don't provide ea, but please contact me here [email protected] to get the details on how to join my trading.
@Marcellus8610
Membre depuis May 19, 2020
posts 321
Aug 08, 2023 at 12:06
Membre depuis May 19, 2020
posts 321
Two GBP/USD trades that I opened yesterday were closed today, both at the take profit level. This allowed me to enter positive profitability in August (the month started with a loss of -1.72%), which is currently 1.79%.
I expected that the take profit level would be reached a little earlier. Half an hour after the open, the market really started moving down, but it was not enough to break through the EMA 200 on the 30-minute chart. After 12 hours, the price again reached the EMA level and after a short term horizontal movement, this level was overcome and GBP/USD fell to take profit values of 1.27451 and 1.27433 and is now at the level of 1.27000, which means that further reaching 1.26800 and 1.26180 is possible.

I expected that the take profit level would be reached a little earlier. Half an hour after the open, the market really started moving down, but it was not enough to break through the EMA 200 on the 30-minute chart. After 12 hours, the price again reached the EMA level and after a short term horizontal movement, this level was overcome and GBP/USD fell to take profit values of 1.27451 and 1.27433 and is now at the level of 1.27000, which means that further reaching 1.26800 and 1.26180 is possible.

@Marcellus8610
Membre depuis Aug 16, 2022
posts 9
Aug 12, 2023 at 20:10
Membre depuis Aug 16, 2022
posts 9
MarcellusLux posted:Patrick2018 posted:
How can I get your strategy
I don't provide ea, but please contact me here [email protected] to get the details on how to join my trading.
Please send the email again, I am trying to contact you, but it's saying invalid email
Membre depuis May 19, 2020
posts 321
Aug 14, 2023 at 17:29
Membre depuis May 19, 2020
posts 321
EUR/USD and EUR/JPY trades are closed at the take profit level. Fairly fast trading on the correction after the fall.
Euro Dollar touched the EMA 100 line on the daily chart and formed a slight divergence on the 4-hour chart. If the EMA 100 at 1.09050 is crossed, then a further fall will have a high probability to the level of the EMA 200 on the daily chart 1.08000. But at the moment, the Euro Dollar has begun a correction movement and the probability of the uptrend continuing also remains.

Euro Dollar touched the EMA 100 line on the daily chart and formed a slight divergence on the 4-hour chart. If the EMA 100 at 1.09050 is crossed, then a further fall will have a high probability to the level of the EMA 200 on the daily chart 1.08000. But at the moment, the Euro Dollar has begun a correction movement and the probability of the uptrend continuing also remains.

@Marcellus8610
Aug 21, 2023 at 15:29
Membre depuis Apr 05, 2023
posts 3
Good morning.
looking forward to joining you when I have enough funds.
I follow many accounts including you Marcel on my fx book and longevity and stability levels over time,
you are the best.
also hoping to have a long-term vision with your project.
Sincerely.
looking forward to joining you when I have enough funds.
I follow many accounts including you Marcel on my fx book and longevity and stability levels over time,
you are the best.
also hoping to have a long-term vision with your project.
Sincerely.
Membre depuis May 19, 2020
posts 321
Aug 25, 2023 at 15:51
Membre depuis May 19, 2020
posts 321
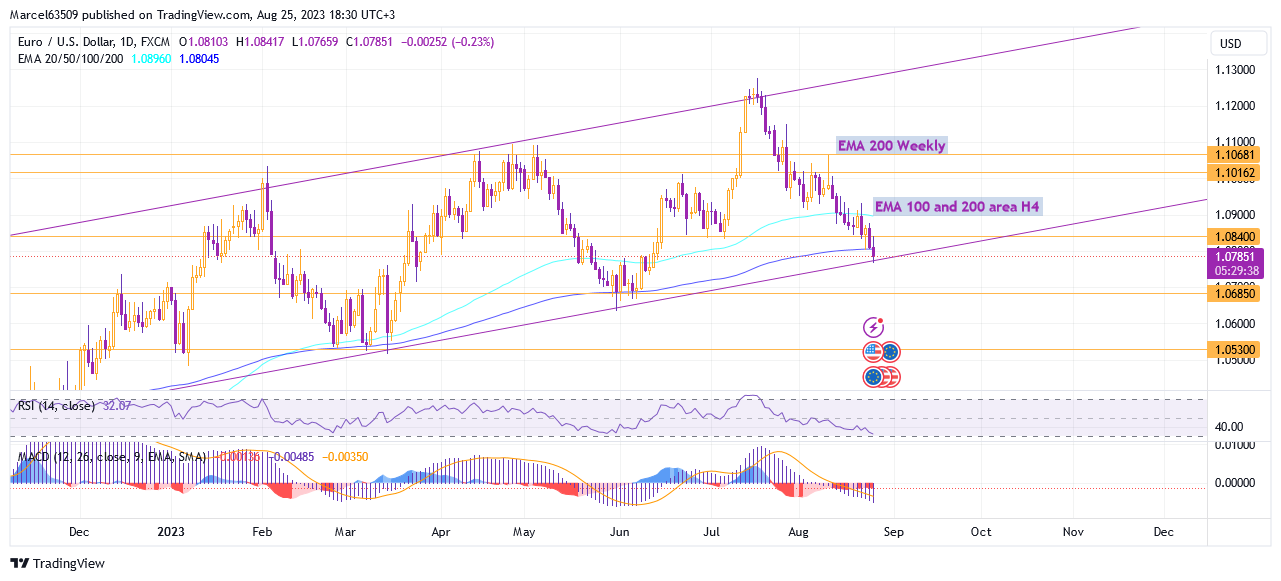
EUR/USD has finally come to an interesting moment on the border of an uptrend. Strong support still keeps the price inside the channel, but I propose to analyze the situation in more detail.
The EMA lines were crossed on the Weekly, Daily, 4-Hour and Hourly charts, which is a strong argument for a break in the trend and a further fall. Also, the MACD on the Weekly chart shows that the current trend is forming with a divergence, which also confirms the option of the price drop below the trend channel. Historical key level 1.06850 will be the most likely level that the price can approach in case of further fall and then I will consider support at 1.05300.
But also the EUR/USD will still be able to return to growth, but only if the current fall is the beginning of a horizontal correction, which will continue along the trend support area. Thus, it will be possible to overcome the resistance of 1.0840 and continue the growth with the background of the current oversold RSI. But I consider the growth option as less probable and I will follow in detail the levels 1.07680 and 1.07450, which will be markers for the further decline.
I also marked some levels inside the trend, which have already been overcome and left far behind, as an argument for falling or as an indicator that further possible growth will have several resistances at key levels 1.09000, 1.10150, 1.10680.
At the moment, the EMA 200 line on the Daily chart you see is the initial marker level and once it is broken without the risk of a false break, the chances of a fall will increase significantly.

@Marcellus8610
Membre depuis May 19, 2020
posts 321
Sep 07, 2023 at 09:34
Membre depuis May 19, 2020
posts 321
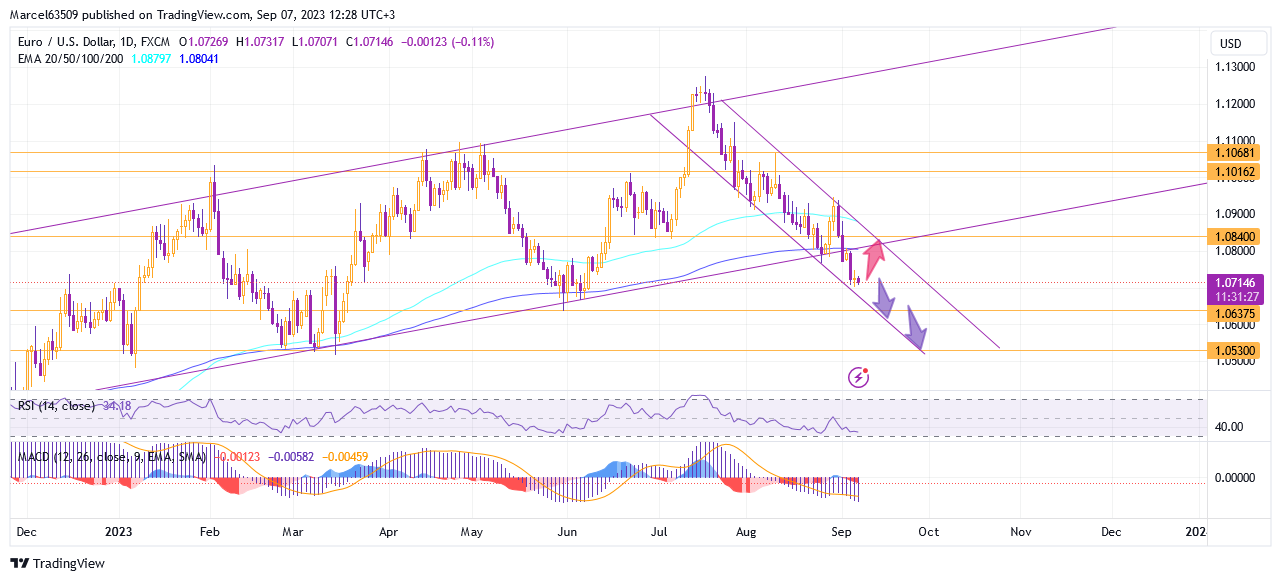
The EUR/USD is reaching the historical key level of 1.06375, which may stop the current decline and become a turning point for a short-term correction. Also, I would like to mention the marker support at 1.07000, which currently has an impact on the market and if the price level falls below it, then a further fall to 1.06375 will be highly likely.
The euro dollar finally broke out of the uptrend, breaking through its support after a short-term rise to 1.09445. The MACD on the daily chart makes it clear that further decline will continue despite the RSI being close to oversold. This and the formed divergence on the hourly chart, may be signals for short-term growth, similar to one that was at the end of August. The estimated level that can be reached during the correction is EMA 200 on the daily chart 1.08000 and also historical 1.08400. However, I consider a return to the trend area to be unlikely and at the moment I expect a continuation of the fall to 1.06375 and further to 1.05300.
In the long term on the weekly chart, the MACD signal and position of the EMA lines, as well as the position of the RSI line, gives reason to believe that we should expect a long term decline.

@Marcellus8610

*Lutilisation commerciale et le spam ne seront pas tolérés et peuvent entraîner la fermeture du compte.
Conseil : Poster une image/une url YouTube sera automatiquement intégrée dans votre message!
Conseil : Tapez le signe @ pour compléter automatiquement un nom dutilisateur participant à cette discussion.


.png)

.png)
.png)

_cF.png)
.png)


