


Advertisement
Gold Weekly Analysis
Jan 15, 2023 at 01:58
768 Views
10 Replies

Member Since Jan 11, 2023
7 posts
Jan 15, 2023 at 01:58
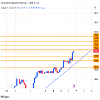
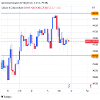
Gold Weekly Analysis - Jan 16th - 20th
Monthly Weekly Supply Demand Support Resistance levels.
Market Environment: Uptrend
Note we are moving into all time highs, there may be a large pull back.
The 5 to 6 Day range is around 2500 - 3000 pips, which puts gold in to the 1950 - 1960 area should the price move up.
As gold continues to move up into the 1920 to 1950 monthly supply area expect pull backs of 1,500 pips or more.
Trend continuation at levels of demand that have become support for long trades opportunities, from 1910 - 1900 - 1880
As the week starts the first area of interest during the Asian Session will be the 1925.00 supply resistance area with opportunities to place short trades down to levels of support should price give us trade confirmation, Then look for long, trend continuation trades at levels of support
Plan your Trades.
Plan your Entry
Plan your Stoploss
Plan your Profit Target
With Great Money Management
Attachments:
Plan your trades, Become a Consistently Profitable Trader
Member Since Jan 11, 2023
7 posts
Jan 26, 2023 at 00:32
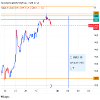
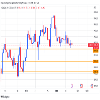
Live update.
Gold Asian Session just gave a 3 5 15 minute intraday short trade signal at the 1950 resistance area.
If the hour candle and 4 hour candle also confirm, that could signal a larger pullback on the day.
Plan your trade entry
Plan your stoploss
Plan your profit targets
Become a consistently profitable trader.
Attachments:
Plan your trades, Become a Consistently Profitable Trader
Member Since Jan 11, 2023
7 posts
Jan 26, 2023 at 00:34
Resistance 1930 - 1950 area
Support 1910 - 1920 area
Gold is reaching all time highs, Current Daily candle is a pin bar, may indicate a larger pull back from the highs before moving higher, or the start of a trend reversal.
Should price break 1950 look for supply to enter the market.
Should price break 1910 look for demand to enter the market.
Plan your Trades.
Plan your Entry
Plan your Stoploss
Plan your Profit Target
Become a consistently profitable trader.
Plan your trades, Become a Consistently Profitable Trader
Member Since Jan 11, 2023
7 posts
Jan 26, 2023 at 01:44
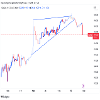
Live Asian Update
Gold Chart Pattern Jan 25th
Supply Resistance level 1950
Pattern:
Raising Wedge Break out Sell Signal
When Chart patterns line up with supply demand support resistance levels, they are a great tool to help you make profitable trades decisions with price confirmation.
Plan your trade entry
Plan your stoploss
Plan your profit targets
Become a consistently profitable trader
Attachments:
Plan your trades, Become a Consistently Profitable Trader

Member Since Mar 31, 2021
222 posts
Jan 26, 2023 at 18:50
I would say that for now on gold there is a false grow. Most of all there will be a great losses. It will happen next week I believe.
Think thrice before opening an order
Member Since Jan 11, 2023
7 posts
Jan 28, 2023 at 04:52
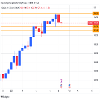
Gold Week in Review Jan 23rd - 27th
Great trading week.
1930 - 1950 Held as supply, resistance early in the week with a pull back down to 1910 -1920 area were price found support for trend continuation.
Gold made a new high towards the end of the week in the 1940 - 1950 area at 1949 depending on your data feed..... Finding support in the 1920 area.
Should 1910 - 1920 hold as support, gold may retest the 1950 area before a greater pull back.
Expect institutional supply and profit taking in the 1950 -1960 area
Should 1910 - 1920 break, the next level of support should be 1880 - 1915
Plan your Trades.
Plan your Entry
Plan your Stoploss
Plan your Profit Target
Become a consistently profitable trader.
Attachments:
Plan your trades, Become a Consistently Profitable Trader
Member Since Jan 11, 2023
7 posts
Jan 29, 2023 at 17:28
Gold Weekly Analysis Jan - 30th - Feb 3rd
Resistance 1930 - 1950 area
Support 1910 - 1920 area
Should price break 1950 look for supply to enter the market.
Should price break 1910 look for demand to enter the market.
Plan your Trades.
Plan your Entry
Plan your Stoploss
Plan your Profit Target
Become a consistently profitable trader.
Resistance 1930 - 1950 area
Support 1910 - 1920 area
Should price break 1950 look for supply to enter the market.
Should price break 1910 look for demand to enter the market.
Plan your Trades.
Plan your Entry
Plan your Stoploss
Plan your Profit Target
Become a consistently profitable trader.
Attachments:
Plan your trades, Become a Consistently Profitable Trader
Member Since Jan 11, 2023
7 posts
Jan 31, 2023 at 03:37
Price is testing the support level of 1920
What to expect from here:
1. False break out short from 1920 then price moves to continue the trend up to 1950 - 2000.
2. Real break out, retest of 1920 as new resistance, then price moves lower to retest support of the 1900 - 1910 area.
What to expect from here:
1. False break out short from 1920 then price moves to continue the trend up to 1950 - 2000.
2. Real break out, retest of 1920 as new resistance, then price moves lower to retest support of the 1900 - 1910 area.
Attachments:
Plan your trades, Become a Consistently Profitable Trader
Member Since Mar 31, 2021
222 posts
Feb 01, 2023 at 18:00
Gold is too volatility today. But I prefer to get profit on sell position in the short term. Hope I will get it.
Think thrice before opening an order

Member Since Jan 25, 2022
89 posts
Feb 08, 2023 at 07:02
Nice topic, but you should keep it going.

*Commercial use and spam will not be tolerated, and may result in account termination.
Tip: Posting an image/youtube url will automatically embed it in your post!
Tip: Type the @ sign to auto complete a username participating in this discussion.


