


Rickshaw Man Technical Analysis Patterns Technical Analysis Patterns
Rickshaw Man Candlestick Definition
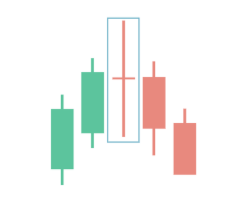
The Rickshaw Man candlestick pattern is a single candlestick pattern that appears in a price chart. It consists of a small body, which represents a small trading range between the open and close price, and long upper and lower shadows, which indicate that the price moved significantly above and below the opening price during the trading period. The length of the shadows relative to the body may vary, but the body is typically small or non-existent. The pattern indicates indecision in the market, with neither the bulls nor the bears being in control.
Is the Rickshaw Man Candlestick Bullish or Bearish?
The Rickshaw Man candlestick pattern is neither bullish nor bearish on its own. Instead, it is a neutral pattern that suggests indecision in the market. It may signal a trend reversal if it appears after a sustained trend, but traders need to look for confirmation from other indicators or patterns before taking a trading position.
Rickshaw Man Candlestick in Up and Down Trends
In an uptrend, a bullish Rickshaw Man candlestick pattern may indicate a temporary pause in the trend or a potential trend reversal. If the pattern appears after a sustained uptrend, it may signal that the buyers are losing momentum, and the bears may take over. However, traders need to confirm the reversal signal with other indicators, such as a bearish divergence in the momentum indicator, a bearish crossover in the moving averages, or a bearish reversal pattern like a head and shoulders.
In a downtrend, a bearish Rickshaw Man candlestick pattern may indicate a temporary pause or a potential trend reversal. If the pattern appears after a sustained downtrend, it may signal that the bears are losing momentum, and the buyers may take over. However, traders need to confirm the reversal signal with other indicators, such as a bullish divergence in the momentum indicator, a bullish crossover in the moving averages, or a bullish reversal pattern like an inverted head and shoulders.
| 1 minute | 5 minutes | 15 minutes | 30 minutes | 1 hour | 4 hours | 1 day | 1 week | 1 month | |
|---|---|---|---|---|---|---|---|---|---|
| AUDCAD | - | - | - | - | - | - | - | - | |
| AUDCHF | - | - | - | - | - | - | - | - | |
| AUDJPY | - | - | - | - | - | - | - | - | |
| AUDNZD | - | - | - | - | - | - | - | - | - |
| AUDSGD | - | - | - | - | - | - | - | - | - |
| AUDUSD | - | - | - | - | - | - | - | - | - |
| CADCHF | - | - | - | - | - | - | - | ||
| CADJPY | - | - | - | - | - | - | - | - | |
| CHFJPY | - | - | - | - | - | - | - | - | - |
| CHFSGD | - | - | - | - | - | - | - | - | |
| EURAUD | - | - | - | - | - | - | - | - | |
| EURCAD | - | - | - | - | - | - | - | - | |
| EURCHF | - | - | - | - | - | - | - | - | |
| EURCZK | - | - | - | - | - | - | - | - | - |
| EURGBP | - | - | - | - | - | - | - | - | |
| EURHUF | - | - | - | - | - | - | - | - | - |
| EURJPY | - | - | - | - | - | - | |||
| EURMXN | - | - | - | - | - | - | - | - | - |
| EURNOK | - | - | - | - | - | - | - | - | - |
| EURNZD | - | - | - | - | - | - | - | - | - |
| EURPLN | - | - | - | - | - | - | - | - | - |
| EURSEK | - | - | - | - | - | - | - | - | - |
| EURSGD | - | - | - | - | - | - | - | - | - |
| EURTRY | - | - | - | - | - | - | - | - | |
| EURUSD | - | - | - | - | - | - | - | - | - |
| EURZAR | - | - | - | - | - | - | - | - | - |
| GBPAUD | - | - | - | - | - | - | - | - | - |
| GBPCAD | - | - | - | - | - | - | - | - | |
| GBPCHF | - | - | - | - | - | - | - | - | - |
| GBPJPY | - | - | - | - | - | - | - | ||
| GBPMXN | - | - | - | - | - | - | - | - | - |
| GBPNOK | - | - | - | - | - | - | - | - | - |
| GBPNZD | - | - | - | - | - | - | - | - | - |
| GBPSEK | - | - | - | - | - | - | - | - | - |
| GBPSGD | - | - | - | - | - | - | - | ||
| GBPTRY | - | - | - | - | - | - | - | - | |
| GBPUSD | - | - | - | - | - | - | - | ||
| NOKJPY | - | - | - | - | - | - | - | - | - |
| NOKSEK | - | - | - | - | - | - | - | ||
| NZDCAD | - | - | - | - | - | - | - | - | |
| NZDCHF | - | - | - | - | - | - | - | - | - |
| NZDJPY | - | - | - | - | - | - | - | - | |
| NZDUSD | - | - | - | - | - | - | - | - | |
| SEKJPY | - | - | - | - | - | - | - | ||
| SGDJPY | - | - | - | - | - | - | - | - | - |
| USDCAD | - | - | - | - | - | - | - | - | - |
| USDCHF | - | - | - | - | - | - | - | - | - |
| USDCNH | - | - | - | - | - | - | - | - | |
| USDCZK | - | - | - | - | - | - | - | - | - |
| USDHUF | - | - | - | - | - | - | - | - | - |
| USDJPY | - | - | - | - | - | - | - | - | - |
| USDMXN | - | - | - | - | - | - | - | - | |
| USDNOK | - | - | - | - | - | - | - | - | - |
| USDPLN | - | - | - | - | - | - | - | - | - |
| USDRUB | - | - | - | - | - | - | - | - | |
| USDSEK | - | - | - | - | - | - | - | - | |
| USDSGD | - | - | - | - | - | - | - | - | |
| USDTHB | - | - | - | - | - | - | - | - | |
| USDTRY | - | - | - | - | - | - | - | ||
| USDZAR | - | - | - | - | - | - | - | - | |
| XAGAUD | - | - | - | - | - | - | - | - | - |
| XAGEUR | - | - | - | - | - | - | - | - | - |
| XAGUSD | - | - | - | - | - | - | - | - | - |
| XAUAUD | - | - | - | - | - | - | - | - | - |
| XAUEUR | - | - | - | - | - | - | - | ||
| XAUGBP | - | - | - | - | - | - | - | - | |
| XAUJPY | - | - | - | - | - | - | - | - | |
| XAUUSD | - | - | - | - | - | - | - | - | - |
| XPDUSD | - | - | - | - | - | - | - | - | |
| XPTUSD | - | - | - | - | - | - | - | ||
| ZARJPY | - | - | - | - | - | - | - | - |


