Edit Your Comment
EUR/USD
Sep 06, 2013 부터 멤버
게시물145
Feb 23, 2015 at 12:54
Sep 06, 2013 부터 멤버
게시물145
Well it depends - if the Greek proposals are refused by the Eurogroup then the deal falls through.... the whole thing has been a roller coaster, and it could go wither way, we HOPE that the deal goes through but we just don't know for sure...
Personally im not actually in the EURUSD for the reasons above.
Personally im not actually in the EURUSD for the reasons above.
HOLY GRAIL: Fundamental Analysis to chose your pairs/direction, Technical Entry/SL/TP for consistent Management of those decisions
Aug 30, 2012 부터 멤버
게시물64
Feb 23, 2015 at 12:55
Aug 30, 2012 부터 멤버
게시물64
Jul 10, 2014 부터 멤버
게시물1114
Feb 23, 2015 at 17:54
Jul 10, 2014 부터 멤버
게시물1114
Range continues for EUR/USD but the pair formed a marubozu candlestick in the daily filter chart which might be an indication that it's about to make a move to the downside. I think the target is around 1.1240, but I doubt the bearish trend will continue.
Jun 08, 2014 부터 멤버
게시물454
Feb 23, 2015 at 18:37
Jun 08, 2014 부터 멤버
게시물454
victoriajensen posted:
Range continues for EUR/USD but the pair formed a marubozu candlestick in the daily filter chart which might be an indication that it's about to make a move to the downside. I think the target is around 1.1240, but I doubt the bearish trend will continue.
Exactly. I agree there is no strong signal on the continuous of the downtrend
Feb 23, 2015 at 18:58
Jun 07, 2011 부터 멤버
게시물372
EUR/USD rebounded on Friday after the Eurogroup has agreed to extend the Greek bailout program for four months.
The pair continues to oscillate between the 1st support 1.1294 (S1) and the 2nd resistance 1.1513 (R2).
The short-term lateralization recommends caution.
The larger trend is still downward, with lower minimum and maximum and below both moving averages 50 and 200 days.
R3 - 1.15975
R2 - 1.15134
R1 - 1.14461
Daily Std. Pivot - 1.13620
S1 - 1.12947
S2 - 1.12106
S3 - 1.11433
Feb 23, 2015 at 19:11
Oct 07, 2014 부터 멤버
게시물134
sherifFares posted:victoriajensen posted:
Range continues for EUR/USD but the pair formed a marubozu candlestick in the daily filter chart which might be an indication that it's about to make a move to the downside. I think the target is around 1.1240, but I doubt the bearish trend will continue.
Exactly. I agree there is no strong signal on the continuous of the downtrend
EURUSD will go to 1.07 levels
THIS IS A MARATHON, NOT A SPRINT.
Oct 08, 2011 부터 멤버
게시물135
Feb 23, 2015 at 19:39
Oct 08, 2011 부터 멤버
게시물135
EUR/USD - daily chart
the daily chart is currently in congestion with today's bar being bar nr. 20.
Earliest bar to trade out of congestion is bar 17
best bars to trade are bar 21 through 29. this rule is valid for any timeframe and any market.
Last Friday's attempt to take out the high from Thursday is called "first time around" on the 4 hr. chart.
If there is another attempt today or tomorrow, it will be called "second time around" and therefore the high from last Friday is a legitimate buy-stop entry.
Place a buy-stop order 1 pip above the high from Friday's ask-price or add 1 pip plus your broker's spread to the bid-price
In a flat congestion like this one it may be best to wait for a doji bar on the daily chart.
A doji has similar open and close prices, which cannot be more than 3 pips apart.
Very important for this kind of trade is the proper lot-size selection.
The proper lot-size (for any trade) can only be calculated, if there is a stop-loss attached to the trade.
Trading any trade without a stop-loss means trading with a "mental" stop, and it is easy to become a victim to the market-makers' and market-operators' stop-running techniques, who know exactly where "mental" stops are sitting.
"a little bit of knowledge is a dangerous thing"
Oct 11, 2013 부터 멤버
게시물769
Aug 30, 2012 부터 멤버
게시물64
Feb 24, 2015 at 07:47
Aug 30, 2012 부터 멤버
게시물64
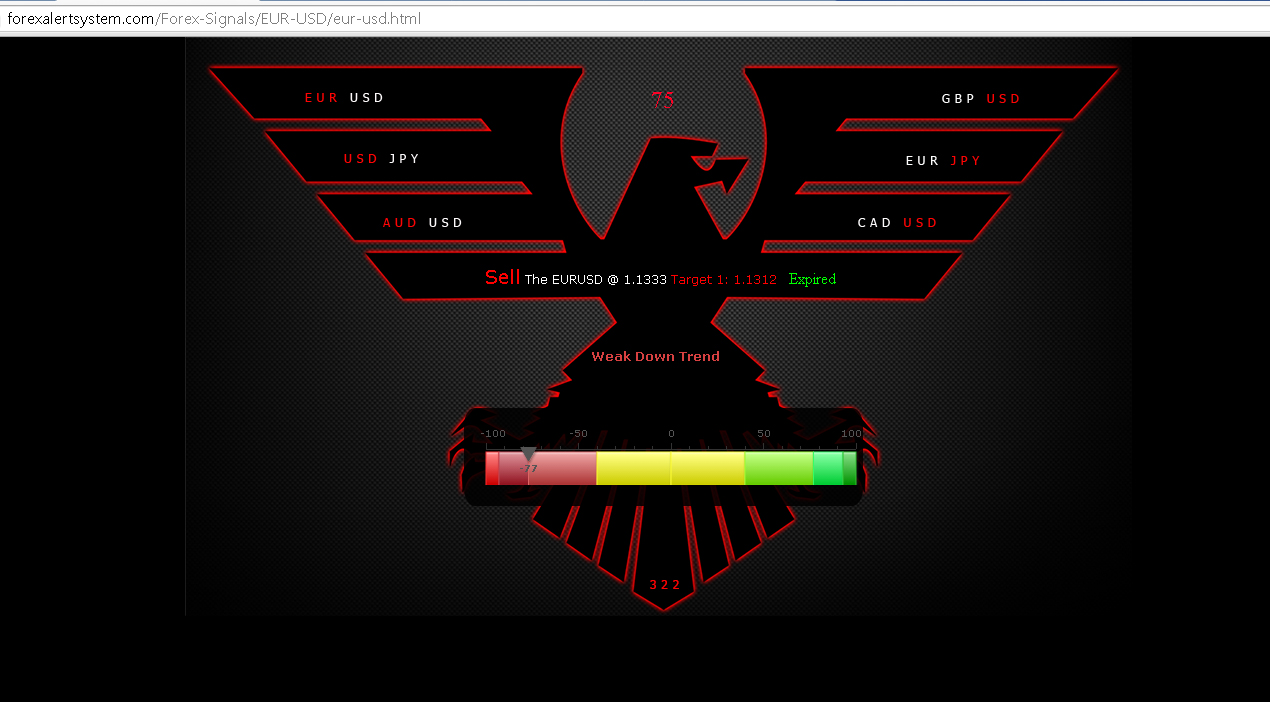
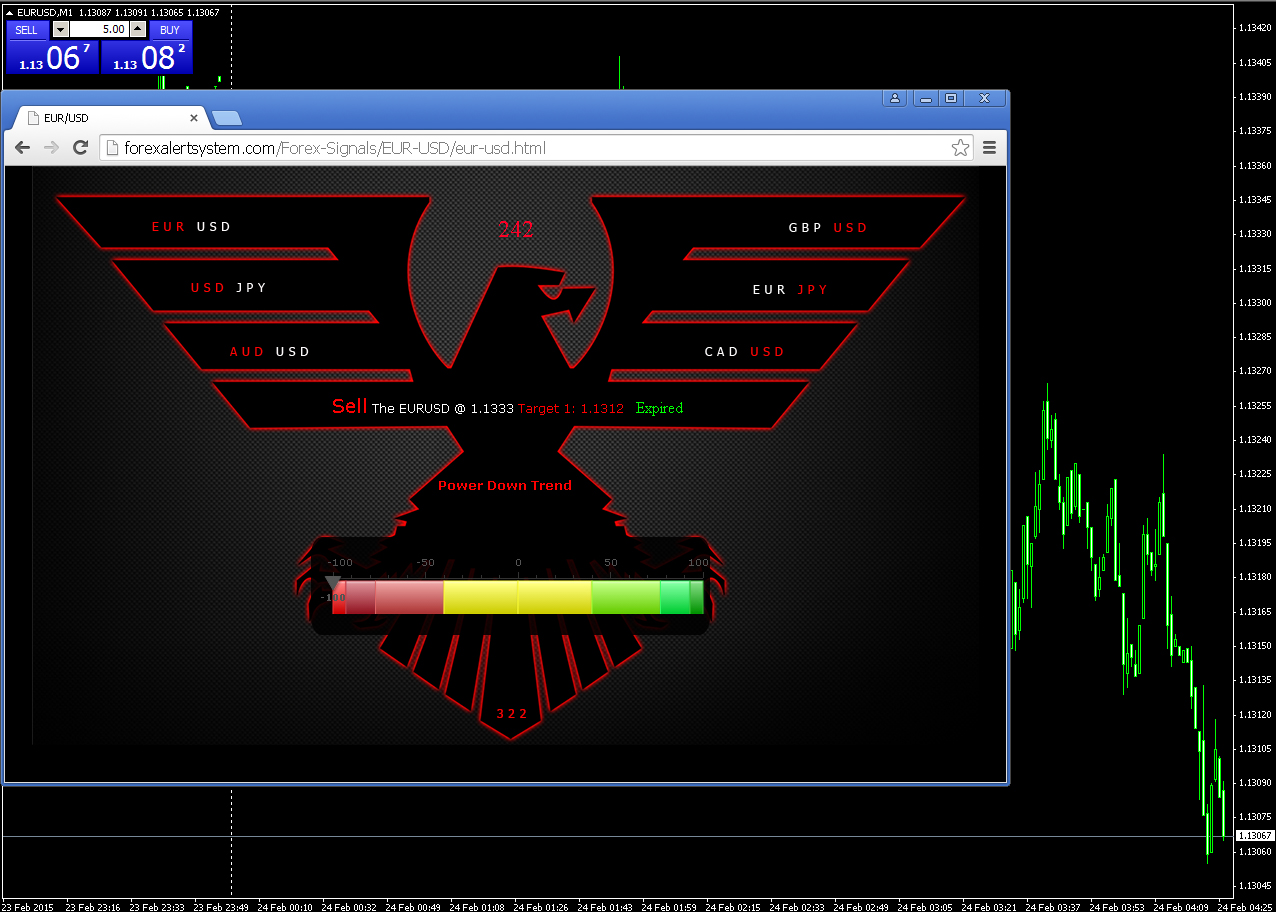
Our system, has already factored in fundamental and technical information and other types of analytic's into the equation. to produce the end result of short /sell (at that moment in time)..... BUT! information in forex can rapidly change and our system can rapidly detect the changes and adapt and show the new direction. so we can act on it immediately! our system just follows the smart money.....
LIKE MY TRADE ALERT POST! TRY IT FREE! NO SIGN UP! 100% FREE - w.w.w.ForexAlertSystem.c.o.m "CLICK ON BIG GREEN TRIAL BUTTON"
Aug 30, 2012 부터 멤버
게시물64
Feb 24, 2015 at 07:48
Aug 30, 2012 부터 멤버
게시물64
Just waiting around for the system to produce some new trade ideas for the new session.... it looks like it will be possible another short... will update you later when i have more information. with this system, we no longer worry about following economic news events. or trying to study chart patterns. that is old school stuff. there are far more important critical data points and phenomenon to follow these days.... welcome to the world of real A.I
LIKE MY TRADE ALERT POST! TRY IT FREE! NO SIGN UP! 100% FREE - w.w.w.ForexAlertSystem.c.o.m "CLICK ON BIG GREEN TRIAL BUTTON"
Aug 30, 2012 부터 멤버
게시물64
Feb 24, 2015 at 08:54
Aug 30, 2012 부터 멤버
게시물64
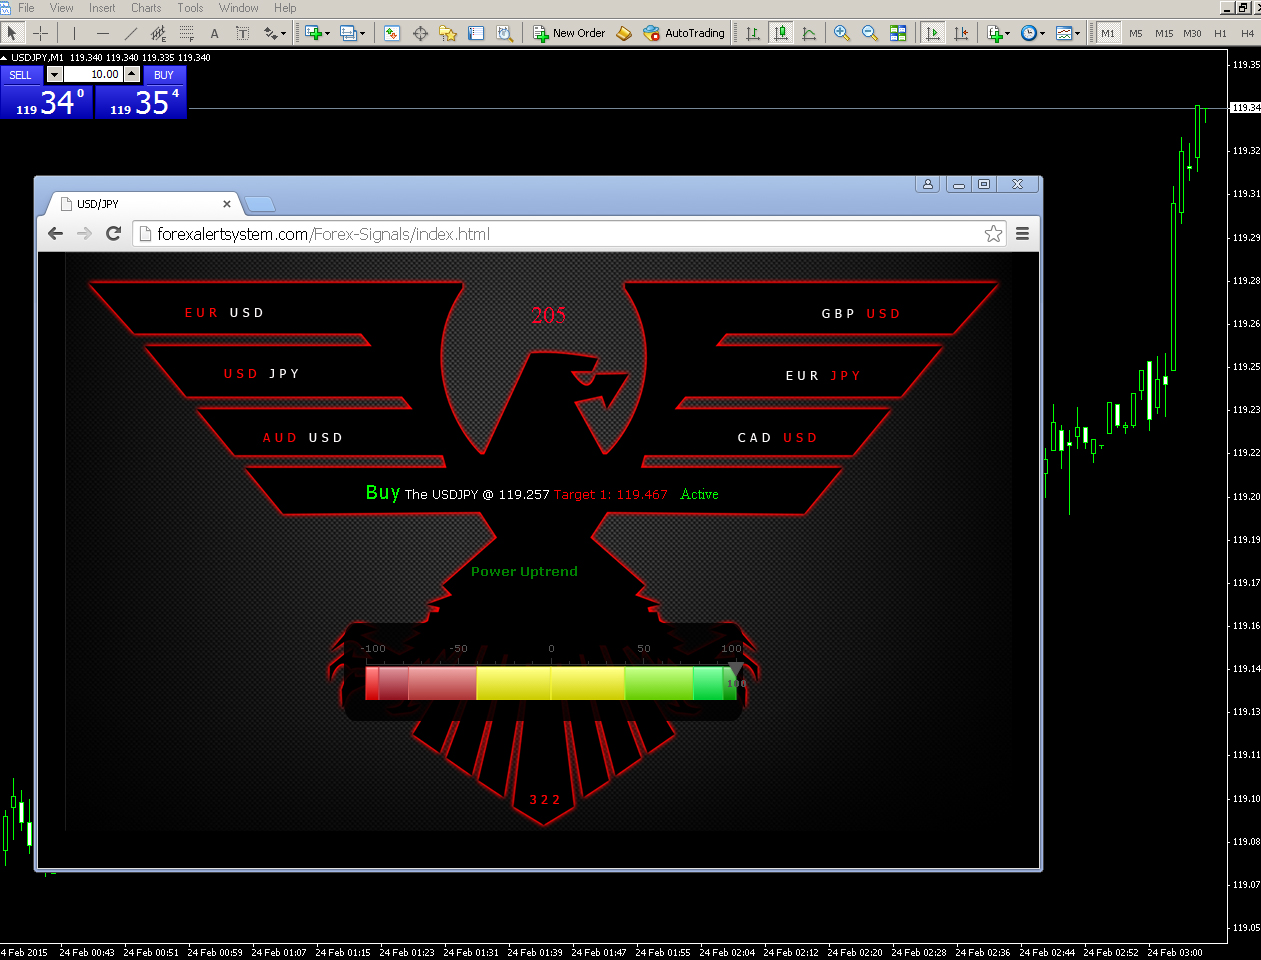
Hello RaphaelGK, This is our current Trade Alert entry since we are also trading the USD/JPY Pair at the moment, hope the image below helps....
But we are getting ready to start booking some open profits on this pair because we have other open positions on other pairs. the system will be busy this session....

But we are getting ready to start booking some open profits on this pair because we have other open positions on other pairs. the system will be busy this session....

LIKE MY TRADE ALERT POST! TRY IT FREE! NO SIGN UP! 100% FREE - w.w.w.ForexAlertSystem.c.o.m "CLICK ON BIG GREEN TRIAL BUTTON"
Feb 24, 2015 at 08:55
Apr 08, 2014 부터 멤버
게시물1140
EURUSD fell during yesterday session, closing in the red, below the 10-day moving average and in the middle of the day’s range. The pair is still consolidating between the top 1.1450 level and the 1.1270 level on the bottom. The currency should continue in consolidation mode until we see a clear break off a support or resistance with an impulsive candle.
"I trade to make money not to be right."
Apr 14, 2014 부터 멤버
게시물230
Feb 24, 2015 at 12:51
Apr 14, 2014 부터 멤버
게시물230
honeill posted:
EURUSD fell during yesterday session, closing in the red, below the 10-day moving average and in the middle of the day’s range. The pair is still consolidating between the top 1.1450 level and the 1.1270 level on the bottom. The currency should continue in consolidation mode until we see a clear break off a support or resistance with an impulsive candle.
I agree with you, eur/usd back in a range.
Oct 08, 2011 부터 멤버
게시물135
Feb 24, 2015 at 16:10
Oct 08, 2011 부터 멤버
게시물135
EUR/USD daily chart update
during this hour, the low from yesterday was traded through, but NOT the low from last Friday (1.1276 on our charts)
Because of this fact, the high from yesterday (1.1395 on our charts) becomes a major entry price point.
Important to note is, that prices have to stay at least 1 pip above the low from Friday.
Take the high from yesterday (ask price) and add 1 pips for a buy-stop entry.
This will also be a valid entry on tomorrow's bar, provided that the low of last Friday is not touched.
A good place for the SL is 1 pips below the low of Friday which is 120 pips below the entry price in this scenario.
To calculate the proper lot size for this trade, the risk one is willing to take has to be determined first.
This is how the lot size needs to be calculated:
Capital: 1000 (use any amount)
Risk: 2% of capital (use any percentage)
Capital (times) Risk (divided by) stop-loss
1000 * 0.002 / 120 = 0.02 standard lots - or -
1000 * 0.02 / 120 = 0.2 mini lots -or-
1000 * 0.2 / 120 = 2 micro lots
This is the best way to preserve your trading capital and should be used for every trade.
NOTE: this calculation is only valid for currency pairings that end with xxx/USD
for other currency pairings, the value of one pip has to be figured into the calculation
"a little bit of knowledge is a dangerous thing"

*상업적 사용 및 스팸은 허용되지 않으며 계정이 해지될 수 있습니다.
팁: 이미지/유튜브 URL을 게시하면 게시물에 자동으로 삽입됩니다!
팁: @기호를 입력하여 이 토론에 참여하는 사용자 이름을 자동으로 완성합니다.


