Reklāma
FxNews—Forex Technical Analysis

Biedrs kopš
45 ieraksti
Oct 02, 2024 at 06:57
EUR/USD Traders Watch $1.109 for Key Signals
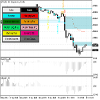
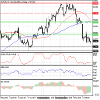
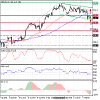
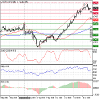
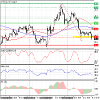
FxNews—The EUR/USD downtrend extended below the $1.109 active resistance. Meanwhile, the Stochastic oscillator stepped into the oversold territory, signaling the trend could reverse or consolidate from the point.
Additionally, the Awesome oscillator signals divergence, backing the Stochastic's signal.
Forecast
Joining an oversold market is not advisable. Hence, traders and investors should monitor the EUR/USD price action near the $1.109 critical resistance for bearish signals, such as bearish engulfing candlestick patterns.
The EUR/USD downtrend will likely resume if the price holds below the 100-period simple moving average. In this scenario, the next bearish target could be the 1.10 mark.
Pielikumi
Knowledge Should Be Free – And So Is Your Path to Trading Success.
Biedrs kopš
45 ieraksti
Oct 02, 2024 at 10:02
EUR/JPY Eyes 160 Resistance Amid Double-Bottom
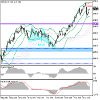
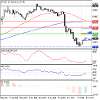
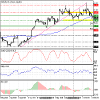
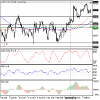
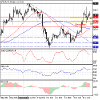
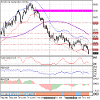
FxNews—The EUR/JPY currency pair is stabilizing its price below the 50-period simple moving average at about 159, forming a double-bottom pattern. Meanwhile, the Awesome oscillator histogram changed its color to green, signaling the bull market gains momentum.
Forecast
The immediate resistance is at 160.0. If the EUR/JPY bulls close above the immediate resistance, the current uptick momentum can potentially target the 163.0 mark.
Bearish Scenario
Conversely, if the sellers push the price below the 100-period SMA, the downtrend will likely be triggered. In this scenario, the next bearish target could be revisiting the 155.5 critical resistance.
Pielikumi
Knowledge Should Be Free – And So Is Your Path to Trading Success.
Biedrs kopš
45 ieraksti
Oct 03, 2024 at 10:24
Watch EUR/USD's Critical $1.10 Support Level
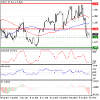
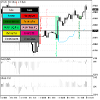
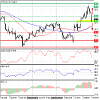
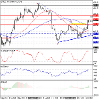
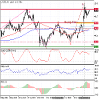
FxNews—The EUR/USD pair's trend turned bearish when sellers pushed the price below the $1.109 critical support level. Subsequently, the strong sell-off drove the Stochastic oscillator into the oversold territory, with the indicator depicting a value of 6.
Forecast
The market is saturated with selling pressure. Despite this, the EUR/USD price has the potential to dip toward $1.10, followed by the $1.095 support.
Due to the Stochastic oversold signal, traders and investors should wait for EUR/USD to consolidate near the 100-period simple moving average (SMA). The $1.109 level, followed by the 100-SMA, provides a good opportunity to join the bearish trend.
Please note, the bear market should be invalidated if EUR/USD stabilizes above $1.109 or the 100-SMA.
Pielikumi
Knowledge Should Be Free – And So Is Your Path to Trading Success.
Biedrs kopš
45 ieraksti
Oct 04, 2024 at 13:12
What Ethereum's Current Retracement Means for Traders
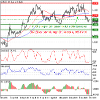
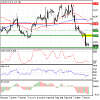
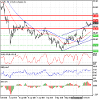
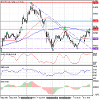
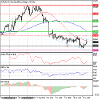
FxNews—Ethereum's price is experiencing a pullback from $2,310, having shifted above the 61.8% Fibonacci level, creating a bearish long-wick candlestick pattern. Meanwhile, the Awesome Oscillator and RSI (14) signal that the bear market is weakening.
The pivot is at $2,435, as shown in green in the 4-hour chart above. This active resistance was identified using the Fibonacci cluster method with the 50% and 61.8% retracement levels. Therefore, the ETH/USD primary trend remains bearish as long as the price stays below $2,435.
Looking ahead, the ETH/USD price is attempting to fill the FVG (fair value gap) area, indicating the price could potentially rise further before the downtrend resumes.
Zooming into the 30-minute chart to find a trigger point for the bearish scenario, the Supertrend line at $2,352 serves as the trigger line. If the bears (sellers) close below $2,352, a new bearish wave will likely be triggered, which could result in Ethereum's price dipping further. In this scenario, the next bearish targets could be revisiting $2,310, followed by $2,250.
The bearish scenario should be invalidated if the ETH/USD price crosses above the $2,435 pivot/resistance.
Pielikumi
Knowledge Should Be Free – And So Is Your Path to Trading Success.
Biedrs kopš
45 ieraksti
Oct 07, 2024 at 10:15
Oversold EUR/USD Pair Testing Major $1.095 Support Zone
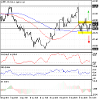
FxNews—The EUR/USD pair is trading bearish, testing the $1.095 critical support in today's trading session. Meanwhile, the Stochastic and RSI (14) indicators hover in the oversold territory, signaling a market saturated with selling pressure.
From a technical perspective, it is not advisable to join the bear market when it is oversold. Hence, retail traders and investors should wait patiently for the EUR/USD price to consolidate near the upper resistance level.
In this scenario, the $1.102 demand zone could provide a decent entry point. Traders should monitor this level for bearish signals, such as a long-wick candlestick pattern or a bearish engulfing pattern.
That said, the next bearish target will likely be $1.088 if the price dips below $1.095. Please note, the bear market should be invalidated if the EUR/USD price crosses above $1.109, supported by the 50% Fibonacci retracement level of the AB wave.
Pielikumi
Knowledge Should Be Free – And So Is Your Path to Trading Success.
Biedrs kopš
45 ieraksti
Oct 07, 2024 at 17:07
GBP/USD Shows Potential for Recovery as Bullish Momentum Builds
FxNews—The GBP/USD pair is trading in a bear market. Meanwhile, the Stochastic Oscillator hovers below the 20 line, signaling that the market is oversold. However, the Awesome Oscillator shows signs of bullish momentum, with green bars approaching the signal line from below.
Forecast
The critical support level is at 1.304. If this level holds, the British pound could potentially erase some of its losses against the U.S. dollar. In this scenario, the GBP/USD price could rise and test the 1.326 resistance, supported by the 100-period simple moving average.
Conversely, if the GBP/USD price falls below the immediate support, a new downtrend will likely be triggered. In this scenario, the bearish wave from 1.343 will likely extend to the next support area at 1.30.
Pielikumi
Knowledge Should Be Free – And So Is Your Path to Trading Success.
Biedrs kopš
45 ieraksti
Oct 08, 2024 at 09:06
Silver Slides Below SMA: Bearish Trend Takes Hold
FxNews—Silver prices have fallen below the 100-period simple moving average, indicating a shift from a bullish to a bearish trend. Currently, silver is testing the support at $30.9, with technical indicators suggesting further declines.
The Stochastic oscillator is at 18, suggesting that silver is oversold and might briefly recover before resuming its downtrend. The Awesome Oscillator has also moved below the signal line, reinforcing the bearish outlook.
If silver breaks below the $30.9 support, it could target the September 18 low of $30.2 and potentially reach the 61.8% Fibonacci retracement level at $29.7.
Bullish Scenario
A reversal above $31.4 or the 100-period SMA would invalidate the bearish trend, potentially pushing prices back to the September 2024 high of $32.7.
Support: $30.9, $30.2, $29.7
Resistance: $31.4, $31.8, $32.7
Pielikumi
Knowledge Should Be Free – And So Is Your Path to Trading Success.
Biedrs kopš
45 ieraksti
Oct 08, 2024 at 18:27
WTI Crude Oil Price Analysis - 8-October-2024
FxNews—WTI crude oil prices fell from $78.4 due to an overbought market signaled by the Stochastic oscillator over 80. The price dipped to $73.3 before rebounding to around $74.4, currently facing resistance at the August 28 low.
Despite a bearish indication from the Awesome oscillator and a downtrend signal from the Relative Strength Index falling below the median line, the overall trend remains bullish. This is supported by prices staying above the 50- and 100-period simple moving averages (SMA).
Bullish Scenario: If the $73.3 resistance holds, an upward move could push prices over $74.8, targeting the $77.5 and possibly retesting the $78.5 highs.
Bearish Scenario: A break below $73.3 could extend losses to the 100-period SMA near $71.4, and further selling might push prices down to the September 13 low of $70.
Support: $73.3, $71.4, $70.0, $67.5
Resistance: $74.8, $77.5, $78.5, $80.0
Pielikumi
Knowledge Should Be Free – And So Is Your Path to Trading Success.
Biedrs kopš
45 ieraksti
Oct 09, 2024 at 09:02
USD/JPY Stuck in Tight Trading Range
FxNews—The USD/JPY currency pair is consolidating in a narrow range, above the 146.8 support and below the 149.4 resistance.
The primary trend is bullish because the U.S. dollar trades above the 50- and 100-period simple moving averages against the Japanese yen. However, the technical indicators show signs of bearish momentum.
> The Stochastic Oscillator is declining, while the Awesome Oscillator bars have turned red and are approaching the signal line from above.
> On the other hand, the Relative Strength Index (RSI) gives a mixed signal, with its value above the median line and rising.
From a technical standpoint, 149.4 is a critical resistance level that has prevented the USD/JPY price from rising further. Therefore, the bulls must close and stabilize the price above 149.4 for the uptrend to resume. If this scenario unfolds, the next bullish target could be the 151.0 resistance area, backed by the daily 100-SMA.
Conversely, a dip below the immediate support at 146.8 could trigger a new bearish wave. In this scenario, the recent bearish momentum could extend to the 144.5 supply zone, followed by 141.5.
Pielikumi
Knowledge Should Be Free – And So Is Your Path to Trading Success.
Biedrs kopš
45 ieraksti
Oct 09, 2024 at 13:24
Gold Bears Eye New Targets Below $2,625
FxNews—Gold price fell below the $2,625 resistance as the Awesome Oscillator histogram turned red, signaling that the bearish trend may gain more momentum. As of this writing, XAU/USD bulls tested the $2,625 resistance, coinciding with the 100-period simple moving average, with the precious metal potentially initiating a new bearish wave.
Forecast
From a technical perspective, if the $2,625 level holds, the next bearish target could be $2,590. Furthermore, if the selling pressure exceeds $2,590, the decline could extend to the 61.8% Fibonacci retracement level of the AB bullish wave at $2,550.
Please note that the bear market should be invalid if the gold price rises above the 100-period SMA.
Pielikumi
Knowledge Should Be Free – And So Is Your Path to Trading Success.
Biedrs kopš
45 ieraksti
Oct 11, 2024 at 11:36
USD/CHF Stabilizes above 50-SMA as Indicators Signal Shift
FxNews—The USD/CHF currency pair consolidates above the 50-period SMA and the $0.854 resistance as expected since the Stochastic was signaling overbought conditions. Interestingly, the Awesome Oscillator histogram not only turned red but also flipped below the signal line, signaling divergence that could result in a trend reversal.
The immediate resistance rests at $0.854. The Swiss Franc could erase some of its losses against the Greenback if bears push the price below the immediate resistance and the 50-period simple moving average. If this scenario unfolds, the next target will likely be the 100-SMA, which is near the 50% Fibonacci retracement level and the $0.85 mark.
Conversely, the bearish outlook should be invalidated if the USD/CHF price exceeds $0.867. If this scenario unfolds, the path for the bulls to the next demand zone at $0.867 could be established.
Pielikumi
Knowledge Should Be Free – And So Is Your Path to Trading Success.
Biedrs kopš
45 ieraksti
Oct 14, 2024 at 11:21
Ethereum Rallies, Breaks $2,500 and Eyes $2,590
FxNews—ETH/USD broke out from the symmetrical triangle last week. Consequently, the uptrend resumed with the passing of the $2,500 critical resistance, which is active support as of this writing. The Ethereum bulls are testing the September 26 low as resistance, while the Stochastic Oscillator shows 91 in the description, meaning Ethereum is overpriced in the short term.
From a technical perspective, it is not advisable to go long when the market is saturated with buyers. That being said, traders and investors should wait for the market to consolidate near the 100-period simple moving average at $2,500. The next bullish target will likely be $2,590 if the 100-SMA holds as resistance.
Conversely, a break below the 100-SMA could result in the ETH/USD rate dropping to the $2,468 area.
Pielikumi
Knowledge Should Be Free – And So Is Your Path to Trading Success.
Biedrs kopš
45 ieraksti
Oct 15, 2024 at 14:14
Cardano Bulls Eye $0.366 Breakout to Resume Uptrend
FxNews—Cardano (ADA/USD) faces the $0.366 hurdle, a strong resistance from which the price has been pulled back at least four times. Interestingly, the price has a fair value gap (FVG) to fill, which could result in the Cardano price targeting the 61.8% Fibonacci retracement level.
Given that the price is above the SMA 100, the trend should be considered bullish. However, for the uptrend to resume, the bulls must stabilize the price above the $0.366 resistance.
That said, the Awesome Oscillator and Stochastic show signs of a bearish market. Hence, Cardano might consolidate before the bullish wave from $0.331 targets $0.382.
Please note, the bullish outlook should be invalidated if ADA/USD falls below the $0.349 immediate support.
Pielikumi
Knowledge Should Be Free – And So Is Your Path to Trading Success.
Biedrs kopš
45 ieraksti
Oct 16, 2024 at 10:56
USD/CAD Consolidation Sparks Speculation of Bearish Momentum
FxNews—The USD/CAD currency pair pulled back from 1.384 as expected since RSI 14, and the Stochastic Oscillator signaled overbought. Meanwhile, the Awesome Oscillator histogram is red and heading toward the signal line from above, meaning the bearish momentum from 1.384 could resume.
From a technical perspective, the USD/CAD currency pair is still overbought. Therefore, we advise traders to exercise patience and wait for the price to consolidate near the lower support levels. In this scenario, a break below the immediate resistance (1.377) could signal a potential downtick momentum, targeting the 23.6% Fibonacci retracement level at 1.374.
Pielikumi
Knowledge Should Be Free – And So Is Your Path to Trading Success.
Biedrs kopš
45 ieraksti
Oct 16, 2024 at 16:58
ETH Bull Run: Eyes on $2,720 After Fibonacci Bounce
FxNews—The Ethereum price tested and bounced from $2,550 and resumed the uptrend, trading bullish above the 61.8% Fibonacci retracement level. The recent dip was anticipated because the Stochastic and RSI 14 were in overbought territory, and the 4-hour chart formed bearish candlestick patterns.
The Awesome Oscillator's recent bar turned green, indicating the current bullish wave should resume. In this scenario, the next bullish target will likely be $2,720. Please note that the bullish outlook will be invalidated if the price dips below the $2,550 support.
Pielikumi
Knowledge Should Be Free – And So Is Your Path to Trading Success.
Biedrs kopš
45 ieraksti
Oct 17, 2024 at 09:43
Litecoin Dips Below $71 Amid Market Warnings
FxNews—Litecoin dipped below the $71.0 critical resistance amid the Awesome Oscillator histogram declining toward the signal line. The market is in an overbought state as RSI 14 is approaching the 70 level.
FxNews analysts advise that retail traders and investors wait patiently for the price to consolidate near the 50% Fibonacci retracement level at $67.5, a supply zone offering a decent opportunity to join the bull market.
The bullish outlook would be invalidated if Litecoin bears push the price below the $67.5 support.
Pielikumi
Knowledge Should Be Free – And So Is Your Path to Trading Success.
Biedrs kopš
45 ieraksti
Oct 18, 2024 at 10:13
GBP/USD Consolidates Amid U.K.'s Retail Sales Surge
FxNews—The U.K.'s retail sales unexpectedly rose 0.3%, which eased the GBP/USD's downtrend around the 1.30 resistance. As of this writing, the currency pair tests the 50-period simple moving average in conjunction with the descending trendline.
Forecast
From a technical perspective, the primary trend remains bearish as long as the pair trades below the critical resistance of 1.325, backed by the 100-SMA. If bulls pull the price above the 50-SMA, a new consolidation phase could emerge, targeting the $1.314 resistance level, which offers a decent bid to join the bear market.
Conversely, a failure to surpass the 50-SMA will likely result in a new bearish wave that could push the price down to the next resistance level, 1.295.
Pielikumi
Knowledge Should Be Free – And So Is Your Path to Trading Success.
Biedrs kopš
45 ieraksti
Oct 18, 2024 at 15:06
Crude Oil Dips Below $69.7, Eyes Next Target at $67.5
FxNews—Crude Oil bears broke the $69.7 critical resistance in the current trading session. This development in the price chart will likely result in the Oil price dipping further. In this scenario, the next bearish target will likely be the $67.5 resistance level.
Please note that the immediate resistance rests at $71.8, which is backed by the 100-period simple moving average. The bearish outlook should be invalidated if the price exceeds the $71.8 mark.
Pielikumi
Knowledge Should Be Free – And So Is Your Path to Trading Success.
Biedrs kopš
45 ieraksti
Oct 23, 2024 at 14:31
Bearish Outlook for AUD/USD with Key Levels in Focus
FxNews—AUD/USD formed a bearish Fair Value Gap (FVG) after the price broke below the $0.665 support level, signaling a potential continuation of the downtrend. Momentum indicators are not yet in oversold territory, suggesting the price still has room for further decline.
Given the formation of the FVG, the Australian dollar may temporarily recover some of its losses near the upper band of the bearish flag before the downtrend resumes.
Furthermore, the next bearish target could be the $0.656 support, provided the critical resistance at $0.669 holds. However, this bearish outlook would be invalidated if AUD/USD breaks above the critical resistance level.
Pielikumi
Knowledge Should Be Free – And So Is Your Path to Trading Success.