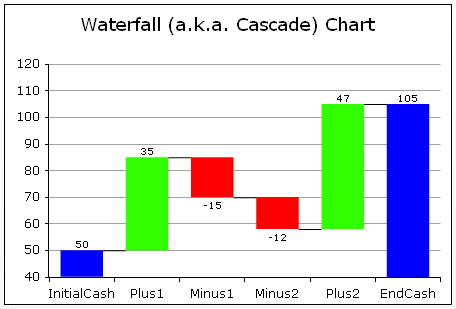
Waterfall Chart vote results
Edit Your Comment
Diskusija
Biedrs kopš
2 ieraksti
May 18, 2012 at 15:27
(labots May 18, 2012 at 15:08)
Biedrs kopš
2 ieraksti
Biedrs kopš
2 ieraksti

*Spams netiks pieļauts, un tā rezultātā var slēgt kontu.
Tip: Posting an image/youtube url will automatically embed it in your post!
Tip: Type the @ sign to auto complete a username participating in this discussion.


