Edit Your Comment
Bitcoin (BTC) analysis thread
Membro Desde Apr 09, 2019
516 posts
Apr 27, 2022 at 18:32
Membro Desde Feb 07, 2015
24 posts
sebking1986 posted:
Still no confidence in the bullish sentiment at the moment. No impetus at all in price action
I feel like more and more financial institutions are waking up to the reality of BTC and the potential problems it can alleviate.
I think more and more notable people are getting involved too.
Maybe I'm watching too much Saylor talk about it - but I'm pretty optimistic.
Sam.peters@
Apr 27, 2022 at 20:25
Membro Desde Oct 20, 2018
283 posts
Hi all.
I`m here again but this time will be a bit more different from the other ones.
I`ll be short and most of you will not like the below chart may be, but in the markets we must be always emotionless.
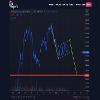
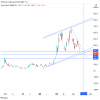
In short, BTC price could be at the edge of the cliff right now. When we look at the daily chart we’re seeing a very good looking ascending channel. That’s bullish right, but when we zoom out we’re seeing something a lot more different than bullish. That’s a bear flag. If you don’t know what a bear flag is then just google it, but a bear flag, like it`s name is showing, is a bear pattern. There’s no confirmation breakdown yet but if this happen we could see a price drop to the mid $20K - around $25000. We just got to be prepared and the world (and BTC) would NOT end with this. Will this happen only the time will show. When will be the bottom if this happen… Think I have something in my pocket to point the bottom but I`ll tell you more about this if and when this drop happen.
That’s it for now. A simple and clear chart. I hope that such negative charts will be less and less in future but that`s the real life. I have something positive prepared for the next time too plus some trading strategies testing but for all of this… when the time have come.
See ya.
momchil_slavov@
Membro Desde Jul 20, 2020
385 posts
May 05, 2022 at 17:50
Membro Desde Dec 09, 2013
138 posts
Bitcoin had a strong bearish day today. It seems that the candle may close below the support. If that happens, the price may remain bearish in the daily chart for a while. There is a down trending trendline. The buyers may have to wait for the price to make a breakout at that resistance to go long in Bitcoin.
Membro Desde Apr 09, 2019
516 posts
May 13, 2022 at 06:44
Membro Desde Dec 09, 2013
138 posts
Bitcoin has been extremely bearish. The daily chart shows that the price made a bearish breakout at 30K. Thus, the sellers may drive the price towards the South as long as the price stays below 30K. I assume that Bitcoin may remain bearish for some weeks.
Membro Desde Jul 20, 2020
385 posts
May 14, 2022 at 14:46
Membro Desde Jul 20, 2020
385 posts
sharabela posted:
Bitcoin has been extremely bearish. The daily chart shows that the price made a bearish breakout at 30K. Thus, the sellers may drive the price towards the South as long as the price stays below 30K. I assume that Bitcoin may remain bearish for some weeks.
Im looking at sub 15k there is a strong institutional marker there
Membro Desde Jul 20, 2019
338 posts
May 14, 2022 at 17:04
Membro Desde Jul 20, 2019
338 posts
momo3HC posted:
Hi all.
I`m here again but this time will be a bit more different from the other ones.
I`ll be short and most of you will not like the below chart may be, but in the markets we must be always emotionless.
In short, BTC price could be at the edge of the cliff right now. When we look at the daily chart we’re seeing a very good looking ascending channel. That’s bullish right, but when we zoom out we’re seeing something a lot more different than bullish. That’s a bear flag. If you don’t know what a bear flag is then just google it, but a bear flag, like it`s name is showing, is a bear pattern. There’s no confirmation breakdown yet but if this happen we could see a price drop to the mid $20K - around $25000. We just got to be prepared and the world (and BTC) would NOT end with this. Will this happen only the time will show. When will be the bottom if this happen… Think I have something in my pocket to point the bottom but I`ll tell you more about this if and when this drop happen.
That’s it for now. A simple and clear chart. I hope that such negative charts will be less and less in future but that`s the real life. I have something positive prepared for the next time too plus some trading strategies testing but for all of this… when the time have come.
See ya.
Oh, wow. Your chart was really well-done with that 25,6k level. 😳
patience is the key
Membro Desde Apr 09, 2019
516 posts
May 19, 2022 at 09:16
Membro Desde Dec 09, 2013
138 posts
Bitcoin seems to have found its support in the daily chart. Since it has been bearish for a long time, so the buyers may wait for the price to have another bounce and produce a Double Bottom. A Double Bottom in the daily chart may make the price go towards the upside.
Membro Desde Apr 09, 2019
516 posts
Membro Desde Jul 20, 2020
385 posts
May 22, 2022 at 14:31
Membro Desde Jul 20, 2020
385 posts
sebking1986 posted:
I think a double bottom is simply a price target for the bigger players
Me too, it is an area where so many institutions know there will be stops placed and liquidity sitting. Its a perfect target in the short and mid term
Membro Desde Apr 09, 2019
516 posts
Membro Desde Jul 20, 2020
385 posts

*Uso comercial e spam não serão tolerados, podendo resultar no encerramento da conta.
Dica: Postar uma imagem/URL do YouTube irá incorporá-la automaticamente no seu post!
Dica: Insira o sinal @ para preencher automaticamente um nome de utilizador que participe nesta discussão.


