- Início
- Comunidade
- Negociantes Experientes
- Technical & Fundamental Analysis by Sold ECN Securities
Advertisement
Edit Your Comment
Technical & Fundamental Analysis by Sold ECN Securities
Mar 11, 2022 at 08:14
Membro Desde Dec 08, 2021
325 posts
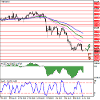
GBPUSD, consolidation near record lows
At the same time, activity on the market remains quite low ahead of the publication of a large block of the UK macroeconomic statistics. Today, traders focus on the January data on GDP and industrial production dynamics. It is assumed that the economy of the United Kingdom may show growth of 0.2% after declining by a similar amount last month. Also, during the day, there will be February estimates of GDP growth from the National Institute of Economic and Social Research (NIESR) and a forecast for the dynamics of consumer inflation. The United States will release the index of consumer confidence from the University of Michigan for March (preliminary forecasts suggest a drop in values from 62.8 to 61.3 points).
Resistance levels: 1.31, 1.315, 1.32, 1.325.
Support levels: 1.305, 1.3, 1.296, 1.29.
Solid ECN, a True ECN Broker
Mar 11, 2022 at 09:30
Membro Desde Dec 08, 2021
325 posts
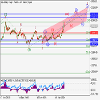
XAUUSD is in a correction, the pair may grow.
On the daily chart, the third wave of the higher level 3 of (5) develops, within which the wave iii of 3 forms. Now, the third wave of the lower level (iii) of iii is developing, within which the wave iii of (iii) has formed, and the correctional wave iv of (iii) is developing.
If the assumption is correct, after the end of the correction, the pair will grow to the levels of 2150 - 2200. In this scenario, critical stop loss level is 1875.
Solid ECN, a True ECN Broker
Mar 11, 2022 at 09:32
Membro Desde Dec 08, 2021
325 posts
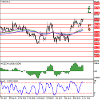
USDCHF, the US dollar ends the week with a strong rise
Thus, the regulator decided to keep the key interest rate unchanged at 0% but announced a more rapid curtailment of the current quantitative easing (QE) program. Key interest rates will remain at their current levels until inflation in the euro area reaches the target level of 2% (in February, the indicator showed an increase to 5.8% against 5.1% a month earlier, becoming a record for the entire history of observations). Therefore, cardinal changes should be expected already in the third quarter of this year. Also, the agency will reduce APP bond purchases to 30B euros in May and then to 20B euros in June, while PEPP asset buybacks will be slower than in the previous quarter and, as planned, completed by the end of March. Analysts believe that the current decisions of the European financial authorities are aimed at maintaining flexibility in the face of market uncertainty caused by the launch of a special military operation of Russian troops in Ukraine.
Support and resistance
Resistance levels: 0.93, 0.9341, 0.9372, 0.94.
Support levels: 0.9271, 0.925, 0.922, 0.92.
Solid ECN, a True ECN Broker
Mar 11, 2022 at 10:45
Membro Desde Dec 08, 2021
325 posts
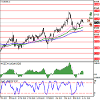
AUDUSD, the Australian dollar is losing ground
Investors are fixing long profits at the end of the week, continuing to take a lead from macroeconomic statistics from the US. The data released yesterday reflected the growth of the Consumer Price Index in the US in February from 0.6% to 0.8%, which fully coincided with analysts' forecasts. In annual terms, inflation in the country accelerated from 7.5% to 7.9%. At the same time, Consumer Price Index excluding Food and Energy over the same period accelerated only from 6% to 6.4% in annual terms, and in monthly terms it slowed down from 0.6% to 0.5%.
Either way, energy prices are the biggest concern at the moment. The development of the military conflict in Ukraine has already caused some countries to adjust their supply chains, and further sanctions against the Russian economy threaten a total restructuring of all the usual energy flows in Europe. Earlier, the United States announced a complete embargo of "black gold" from Russia, but the eurozone authorities are not yet ready to join this decision, since they are more dependent on imports from Russia. Nevertheless, the leaders of European countries announced a course towards the gradual abandonment of oil and gas from Russia, condemning the actions of the authorities of this country in Ukraine.
Support and resistance
Resistance levels: 0.7366, 0.744, 0.75, 0.755.
Support levels: 0.73, 0.725, 0.72, 0.7158.
Solid ECN, a True ECN Broker
Mar 14, 2022 at 07:13
Membro Desde Dec 08, 2021
325 posts
EURUSD, the euro is testing 1.09
The European currency shows mixed dynamics of trading against the US dollar during the Asian session, consolidating near 1.09 in anticipation of new movement drivers.
EURUSD ended last week's trading with an active two-day decline, which almost completely leveled the instrument's attempt to grow on Tuesday and Wednesday. Significant support for the euro was provided by the rhetoric of the European Central Bank (ECB), which announced the curtailment of the quantitative easing (QE) program sooner than expected. Asset purchases will be slowed down from 40 billion euros in April to 30 billion euros in May and to 20 billion euros in June, although earlier it was planned to gradually reduce from 40 billion euros to 20 billion euros by October. The "hawkish" rhetoric of European officials means that before the end of the year, the regulator will be able to get additional space to start a full-fledged tightening of monetary policy through an increase in interest rates, which will remain at current values until inflation reaches the target value of 2%.
In turn, pressure on the euro continues as the conflict escalates in Ukraine, where Russian troops continue to conduct a special military operation. Western countries are introducing more and more new sanctions against businesses and individuals. US authorities have already banned the import of oil, gas and other energy products from Russia, and Europe, in turn, being more dependent on Russian exports, is likely to act gradually. The European Commission has already presented a project for an accelerated phase-out of Russian energy carriers, under which the EU's need for gas from Russia will be reduced by two-thirds by the end of 2022. At the moment, the EU imports 90% of "blue fuel", about 45% of which is supplied by the Russian Federation.
Support and resistance
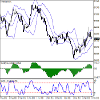
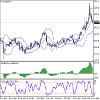
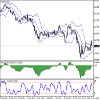
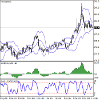
Bollinger Bands in D1 chart demonstrate active decrease. The price range is narrowing, reflecting the emergence of ambiguous dynamics of trading in the short term. MACD is declining keeping a weak sell signal. Stochastic shows more confident negative dynamics, but at the moment it is rapidly approaching its low, indicating the risks of EUR being oversold in the ultra-short term.
Resistance levels: 1.0957, 1.1, 1.1054, 1.11.
Support levels: 1.09, 1.086, 1.08, 1.0767.
Solid ECN, a True ECN Broker
Mar 14, 2022 at 09:35
Membro Desde Dec 08, 2021
325 posts
NZDUSD, the instrument develops a corrective impetus
The New Zealand dollar starts the week with a slight decline against the US currency, trying to consolidate below the psychological support level at around 0.68.
The pressure on the position of the instrument is exerted by the continuing demand for safe assets as the geopolitical situation in Europe worsens. In addition, the market is alarmed by the sharp rise in energy prices around the world, as well as the likelihood of further deterioration of the situation as Western countries abandon Russian oil and gas. Additional support for the US currency is provided by the expectations of the launch of a cycle of tightening monetary policy by the US Federal Reserve this week. The regulator's meeting will take place on Wednesday, and current market forecasts suggest that the rate will be increased by 25 basis points.
Published on Friday, macroeconomic statistics from New Zealand and the US were mixed. Thus, the Manufacturing PMI of New Zealand in February showed a slight increase from 52.3 to 53.6 points, which fell short of analysts' forecasts at the level of 54.5 points. At the same time, the Food Price Index unexpectedly fell by 0.1% in February after rising by 2.7% in January. The market expected the index to slow down to 1.3%. Data from the US, in turn, disappointed investors with a noticeable drop in Consumer Confidence Index from the University of Michigan in March from 62.8 to 59.7 points, while the market expected a decline to only 61.4 points.
Support and resistance
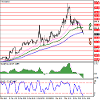
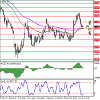
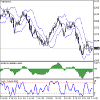
Bollinger Bands on the daily chart show a weak increase: the price range is narrowing, reflecting the emergence of multidirectional dynamics in the short term. MACD is falling, keeping a fairly strong sell signal (the histogram is below the signal line). Stochastic shows an even more active decline, but is located in close proximity to its lows, which indicates the risks of the New Zealand dollar being oversold in the nearest time intervals.
Resistance levels: 0.6795, 0.684, 0.6866, 0.69.
Support levels: 0.6766, 0.6732, 0.67, 0.665.
Solid ECN, a True ECN Broker
Mar 15, 2022 at 08:31
Membro Desde Dec 08, 2021
325 posts
Gold prices are actively corrected
Gold prices are developing a corrective downtrend during the morning session, updating local lows from March 4 and rapidly retreating from their record highs, the growth to which was provoked by Russia's special military operation in Ukraine. Now, the demand for risky assets is gradually recovering, as traders are counting on significant progress in the negotiation process and some stabilization of the global economy if, after a truce is reached, part of the blocking sanctions against the Russian Federation are lifted.
In turn, the development of "bearish" trend in the asset is supported by the strengthening of the US dollar on the eve of the US Federal Reserve meeting scheduled for Wednesday. Current market forecasts suggest a 25 basis point hike in interest rates, marking the welcome start of a monetary policy adjustment cycle. In the latest commentary by the Chairman of the department, Jerome Powell, he mentioned multiple increases in rates this year, taking into account rising inflation, which, in turn, will become a catalyst for strengthening the national currency. At the same time, the yield on 10-year US Treasuries has already risen by 13 basis points, hitting a 32-month high, and the UK gold rate has corrected to its highest level since 2018.
As for macroeconomic statistics from China, it turned out to be positive: Retail Sales in February increased by 6.7% after rising by 1.7% in the previous month, while analysts had expected a 3.0% increase.
Resistance levels: 1952, 1974, 2000, 2015.
Support levels: 1918, 1900, 1877, 1860.
Solid ECN, a True ECN Broker
Mar 15, 2022 at 09:47
Membro Desde Dec 08, 2021
325 posts
Brent Crude Oil, quotes have renewed local lows
During the Asian session, Brent Crude Oil prices are falling, renewing local lows of the beginning of the month and testing the level of 99.00 for a breakdown. The instrument has lost 23% in value since March 7, after hitting a 14-year high at 139.13.
Investors are gradually returning to risk as the geopolitical situation somewhat stabilizes, but in general, the situation remains quite tense: Russian troops continue to conduct a special military operation on the territory of Ukraine for the third week already. Against this background, sanctions pressure on the Russian Federation from Western countries leads to increased risks for the global economy. Last week, the Russian authorities demanded from the United States guarantees that the economic restrictions imposed would not impede full-fledged trade, economic, and investment cooperation between Moscow and Tehran in the restoration of the agreement on the Iranian nuclear program. And yet, after a long period filled with exclusively negative reports, investors hope that significant progress will be made in the negotiations between the Russian and Ukrainian delegations.
The focus of the market is also on the decision of the US Federal Reserve on interest rates, which will be announced on Wednesday evening. Analysts forecast an increase of at least 25 basis points. Still, investors are also awaiting comments from the head of the regulator, Jerome Powell, who may announce specific steps and dates for adjusting monetary policy parameters to curb inflationary pressure in the country soon.
Also, traders monitor the further development of the coronavirus epidemic in China, the world's largest importer of crude oil and the second-largest consumer after the United States. So, the authorities decided to quarantine the city of Shenzhen amid an increase in the incidence of COVID-19 (60 cases of infection were detected). At the moment, all commercial organizations, except for food and fuel, are required to either suspend work or transfer employees to a remote mode.
Resistance levels: 102.8, 105, 108.18, 112.
Support levels: 100, 96, 93, 91.00.
Solid ECN, a True ECN Broker
Mar 23, 2022 at 07:04
Membro Desde Dec 08, 2021
325 posts
GBPUSD, the pound is updating local highs
The British pound is trading with the uptrend against the US currency during the morning session, updating local highs from March 4.
Eurozone countries found themselves in a vulnerable position due to the developing crisis around Ukraine. The European authorities are preparing a new package of sanctions against the Russian economy, which may include significant restrictions or even a complete embargo on energy imports. This will lead to explosive inflation in commodity markets and call into question the ability to ensure energy security. Undoubtedly, high oil and gas prices will have an extremely negative impact on the UK economy, but London today is much less dependent on imports from the Russian Federation, and therefore joined the embargo initiated by the United States earlier.
Resistance levels: 1.33, 1.335, 1.3435, 1.35.
Support levels: 1.325, 1.32, 1.31, 1.305.
Solid ECN, a True ECN Broker
Mar 23, 2022 at 08:48
Membro Desde Dec 08, 2021
325 posts
Gold, a backlash against the "hawkish" rhetoric of the US Fed
The official said that the regulator is ready to raise the rate immediately by 50 basis points at one or more of the next meetings and will soon launch a program to reduce the balance sheet, according to the latest estimates, reaching 9T dollars. Also, The Goldman Sachs Group Inc. analysts forecast two adjustments of 50 basis points at once from the next meeting and then four increases of 25 basis points before the end of the year. The "hawkish" tone of Powell's remarks spurred US bonds higher and affected the bond market, with the US dollar index turning sideways around 98.500 amid heightened investor attention to risky assets and the yield on 10-year US Treasury bonds reached 2.81%. Against this background, gold has expectedly declined, although the demand for shelter assets has generally remained very high in recent days.
The metal is supported by the expectations of new packages of EU sanctions against the Russian economy. This week, EU leaders will meet to discuss the fifth package of restrictive measures that could include a broader ban on Russian energy imports. It is worth noting that there is no single position on this issue: Germany opposes a complete ban while not excluding the possibility of finding alternatives.
Resistance levels: 1930, 1952.5, 1974.2, 2000.
Support levels: 1900, 1877.6, 1860, 1840.
Solid ECN, a True ECN Broker
Mar 23, 2022 at 11:36
Membro Desde Dec 08, 2021
325 posts
Brent Crude Oil, "black gold" returned to growth
Brent Crude Oil quotes continue to recover after a significant correction last week and are currently in the 116.70 area.
Fears that China will seriously reduce energy consumption due to a new outbreak of the coronavirus pandemic have not yet been justified, and peace negotiations between Russia and Ukraine have stalled, which again brought price support factors back to the fore. The possibility of new sanctions against Russian oil supplies and the lack of progress on the "nuclear deal" with Iran, which the market has been waiting for several weeks, is acting as a catalyst for the demand that is currently impossible to cover since the largest producers, Saudi Arabia and the United Arab Emirates, are not able to quickly increase production. Also, the oil infrastructure of Saudi Arabia is periodically attacked by the Yemeni Houthis, which creates problems for the export of "black gold" to the market.
Among the short-term factors for the growth of the trading instrument, the American Petroleum Institute (API) report published yesterday recorded a reduction in US inventories by 4.280M barrels at once instead of the expected growth by 0.025M barrels and a reduction in oil exports via the Caspian pipeline by 1.0M barrels per days due to damage requiring repair. The likely refusal of the EU countries to impose an embargo on supplies from Russia cannot seriously slow down the growth of quotations. It is already being taken into account by the market, as the leader of the European economy, Germany, opposes such measures.
Resistance levels: 117, 125, 132.
Support levels: 110.7, 100, 92.8.
Solid ECN, a True ECN Broker
Mar 24, 2022 at 07:02
Membro Desde Dec 08, 2021
325 posts
NZDUSD, the instrument retreats from local highs
The New Zealand dollar shows the development of downward corrective trend in tandem with the US currency during the Asian session, again testing the level of 0.695 for a breakdown. The NZDUSD pair has been retreating from its local highs since November 2021 without testing the strong resistance at 0.7 for a breakout.
The development of the "bearish" dynamics on the instrument is supported by technical factors, while the position of the US currency on the market changes slightly and remains quite strong against the backdrop of worsening economic prospects as the conflict over Ukraine, where Russian troops continue to conduct a special military operation, develops. Western countries are increasing sanctions pressure on the Russian economy, despite the noticeable back-effect of restrictions. The most important issue at the moment remains a potential embargo on Russian energy imports, which is likely to provoke a sharp complication of the situation in the European energy sector and lead to even greater inflationary pressures.
The positions of the New Zealand dollar are quite strong against the backdrop of trends in commodity areas. At the same time, analysts are paying attention to new outbreaks of coronavirus in New Zealand. Over the past day, more than 18K new cases of infection were detected in the country. Despite the pandemic, New Zealand's GDP returned to growth in the last quarter of 2021, but the increase was only 3.0%, falling short of economists' expectations of growth of 3.2%.
Resistance levels: 0.7, 0.704, 0.71, 0.715.
Support levels: 0.6924, 0.69, 0.6866, 0.684.
Solid ECN, a True ECN Broker
Mar 24, 2022 at 08:28
Membro Desde Dec 08, 2021
325 posts
Silver, the price is consolidating near 25
Silver prices show a moderate decline during the Asian session, correcting after a fairly strong increase the day before on the back of lower yields and risk aversion in financial markets. However, the USD Index is rising for the second day in a row, renewing an intraday high around 98.800, adding 0.14%. XAG/USD is again testing 25 for a breakdown; however, there are not so many drivers for the development of the "bearish" trend.
The "hawkish" rhetoric of the US Federal Reserve had only a brief downward effect on safe-haven assets, after which the demand for silver, gold and a number of other trading instruments began to recover again. Traders are concerned about the uncertainty posed by the conflict in Eastern Europe ahead of US President Biden's meeting with his North Atlantic Treaty Organization (NATO) allies in Brussels. The special military operation carried out by Russian troops in Ukraine has been going on for a month already, while it is still premature to talk about the prospects for its completion. The peace talks, which continue to this day, have not led to any clear results due to the cardinal contradictions in the positions of the parties.
At the end of the week, investors expect an emergency EU summit to consider new sanctions against the Russian economy. The focus will be on the issue of a possible embargo on energy supplies from the Russian Federation to the EU countries. In addition, according to US Senator John Cornyn, he met with US Treasury Secretary Janet Yellen to discuss sanctions on Russian gold.
Resistance levels: 25.35, 25.58, 26, 26.27.
Support levels: 25, 24.67, 24.42, 24.
Solid ECN, a True ECN Broker
Mar 24, 2022 at 10:01
Membro Desde Dec 08, 2021
325 posts
Germany's energy sector faces new challenges
The key news for the market is the statement of the President of the Russian Federation Vladimir Putin, who instructed to convert all payments for natural gas supplies into rubles as soon as possible, and for the first time, the new technology will be tested in Europe. It will create some difficulties for buyers. According to German Economy Minister Robert Habeck, although the country considers such a decision to be a violation of contractual obligations, it is still impossible to refuse gas supplies from Russia. Later, the head of the Bundestag Committee on Economics and Energy, Klaus Ernst, noted that it is technically possible for Germany to pay for fuel in Russian rubles but this forces energy consumers to bypass their own sanctions restrictions, which is not entirely logical.
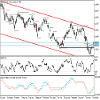
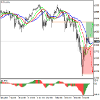
On the global chart, the price moves within the correction to the previous decline. Technical indicators keep a sell signal, which has almost been cancelled: indicator Alligator’s EMA fluctuations range narrowed almost completely, and the histogram of the AO oscillator reached the transition level.
Resistance levels: 14555, 15350.
Support levels: 14000, 12600.
Solid ECN, a True ECN Broker
Apr 01, 2022 at 09:09
Membro Desde Dec 08, 2021
325 posts
EURUSD, euro is correcting at the end of the week
The European currency shows flat dynamics of trading against the US dollar during the Asian session, consolidating near 1.1060 and waiting for new drivers. The day before, the euro showed a sharp weakening against the US currency, which did not allow the instrument to consolidate on new local highs from March 1.
The return of "bearish" trend was due to the growth of negative sentiments regarding the impact of sanctions against Russia on the global and European economy in particular. Among other things, analysts are trying to assess the prospects for interruptions in gas supplies to the EU due to the introduction of a new mechanism for paying current and subsequent contracts in rubles. Many European countries have said they will not make concessions to Russia, which could lead to a potential cessation of exports by the Russian Federation.
The macroeconomic statistics from the EU published yesterday had only a minor impact on the dynamics of the instrument. Retail Sales in Germany rose by 0.3% in February, which was slightly worse than market expectations at the level of 0.5%. In annual terms, sales volumes slowed down from 10.4% to 7.0%, while experts expected a fall to 6.1%. At the same time, the German labor market in March showed very encouraging resilience on the eve of a new possible crisis. The Unemployment Change in the country fell by 18K, slowing down, however, after a decline of 33K.
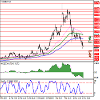
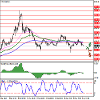
In the D1 chart, Bollinger Bands are reversing horizontally. The price range is almost unchanged, reflecting the development of flat dynamics of trading in the short term. MACD is growing preserving a weak buy signal (located above the signal line). Stochastic, having reached the level of "80", reversed into a descending plane, reacting to the appearance of corrective dynamics on the results of Thursday.
Resistance levels: 1.11, 1.115, 1.1185, 1.122 | Support levels: 1.1051, 1.1, 1.0957, 1.09
Solid ECN, a True ECN Broker
Apr 04, 2022 at 08:57
Membro Desde Dec 08, 2021
325 posts
Gold, rising US Treasury yields are pushing the instrument lower
Gold prices are developing "bearish" dynamics, testing the level of 1920.00 for a breakdown. XAU/USD builds on the downward momentum that was formed at the end of last week, when the US currency received support after the publication of a strong report on US Non-Farm Payrolls and an increase in Treasury yields amid market expectations of a tightening of the US Federal Reserve policy, which could become a catalyst for raising interest rates soon.
As expected, the economy created a little less than 500K new jobs, but at the same time showed a steady increase in Average Hourly Earnings and a drop in the Unemployment Rate from 3.8% to 3.6% (forecasts suggested a decrease to only 3.7%). Strong data confirmed the likelihood that the US regulator will decide to raise interest rates during its May meeting by 50 basis points at once. At the same time, markets are also reacting with a noticeable increase in the yield of US Treasury bonds: on 10-year securities, it rose to 2.414% on Monday morning after closing at 2.375% at the end of last week.
In turn, gold is still supported by the tense situation around Ukraine. The positive impetus received from the results of the next round of talks between the Ukrainian and Russian delegations in Turkey at the beginning of last week seems to have leveled off after the appearance of new evidence of the aggravation of the situation in certain territories of Ukraine and, in particular, in the Bucha district. Meanwhile, Western countries have announced their readiness to impose new sanctions against the Russian Federation, which threatens to further complicate the situation with rising energy prices. Against this backdrop, gold quotes will continue their uptrend, as investors will redirect their capital to safe-haven assets in order to minimize risks.
Support and resistance
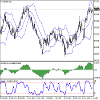
Bollinger Bands in D1 chart demonstrate flat dynamics. The price range is slightly narrowing from above, reflecting ambiguous dynamics of trading in the short term. MACD is declining keeping a weak sell signal (located below the signal line). Stochastic, after a short rise at the beginning of the last trading week, is again reversing into a horizontal plane. It is necessary to wait for the trade signals from technical indicators to become clear.
Resistance levels: 1930, 1952, 1974, 2000 | Support levels: 1900, 1877, 1860, 1840
Solid ECN, a True ECN Broker
Apr 04, 2022 at 10:17
Membro Desde Dec 08, 2021
325 posts
AUDUSD, the instrument is testing 0.7500 for the breakout
During the Asian session, the AUDUSD pair is actively growing, re-testing the level of 0.7500 for the breakout. The instrument is developing a "bullish" momentum formed at the end of the last week. However, the general dynamics of the short-term outlook remain flat for now.
A strong report on the US labor market, published on Friday, did not allow quotations to consolidate on new local highs. However, the data from Australia were also positive. Thus, the AiG manufacturing activity index rose from 53.2 to 55.7 points for March, which outpaced the average market forecasts, while the Australian Commonwealth Bank manufacturing PMI index rose from 57.3 to 57.7 points over the same period against neutral expectations of investors. The National Reserve Bank Commodity Price Index accelerated from 34% to 40.9% in March, well above the expected 10% rise. At the same time, statistics on the credit market disappointed traders: for February, the volume of mortgage loans issued decreased by 4.7% after increasing by 1% last month, although preliminary market estimates suggested an increase of 1%. An additional "bearish" factor for the asset is the index of the number of vacancies published today by the Australian financial group ANZ. For March, the indicator slowed down sharply from 8.4% to 0.4%, significantly worse than market forecasts of 1.6%.
Support and resistance
On the daily chart, Bollinger bands are steadily rising: the price range is actively narrowing, indicating ambiguous trading dynamics in the short term. The MACD indicator falls, keeping a poor sell signal (the histogram is below the signal line). Stochastic interrupted its confident fall and reversed into a horizontal plane approximately in the center of its working area.
Resistance levels: 0.755, 0.76, 0.765, 0.77 | Support levels: 0.75, 0.744, 0.7366, 0.73
Solid ECN, a True ECN Broker
Apr 05, 2022 at 07:38
Membro Desde Dec 08, 2021
325 posts
GBPUSD, flat dynamics in the short term
The pound shows a weak upward dynamics of trading during the morning session, developing the "bullish" momentum formed the day before, when GBP/USD retreated from the local lows of March 30. Demand for the British currency remains quite low, and in general, the instrument shows rather flat dynamics in the short term, due to growing risks of increased pressure against the Russian economy due to the situation in Ukraine.
Western countries are discussing the introduction of another package of sanctions against the Russian economy, referring to the crimes of the Russian military in the Ukrainian city of Bucha. New restrictions could include a ban on Russian ships using EU ports, an embargo on coal, oil or gas supplies, and personal sanctions.
The UK announced a complete embargo on Russian oil imports back in March, as the dependence of the British economy on energy from the Russian Federation is significantly lower than that of European countries. However, prices for "black gold", gasoline and gas are growing here too, threatening the pace of national economic recovery. Earlier, the Governor of the Bank of England, Andrew Bailey, warned that the country could face the most powerful crisis since 1970, and inflation by the end of 2022 could reach 9%.
It should also be noted that the British Chancellor of the Exchequer Rishi Sunak said that he had instructed the Royal Mint to develop and issue its own non-fungible token (NFT) by this summer. Thus, the British authorities are trying to take a leading position in the crypto space and take the regulation of digital assets in the country to a new level. In particular, some tokens will be included in the national payment system to legalize work with them, traders will be able to receive advice when trading, and groups will be created to interact with crypto assets, chaired by ministers and members of regulatory bodies in the UK and industry.
In the D1 chart, Bollinger Bands are reversing horizontally. The price range is almost constant, remaining rather spacious for the current level of activity in the market. MACD is growing preserving a weak buy signal (located above the signal line). Stochastic turned into a horizontal plane in the center of its area, indicating an approximate balance of power in the short and ultra-short term.
Resistance levels: 1.315, 1.32, 1.325, 1.33 | Support levels: 1.31, 1.305, 1.3, 1.296
Solid ECN, a True ECN Broker
Apr 06, 2022 at 10:33
Membro Desde Dec 08, 2021
325 posts
EURUSD, the euro develops a downtrend
The European currency is trading with a slight decrease against the US dollar during the Asian session, testing 1.0900 for a breakdown and updating local lows from March 9. Market sentiment correlates with the predominantly "bearish" trend in EURUSD since the end of last week.
Investors are assessing the prospects for further acceleration of inflation in the region as the EU considers the introduction of another package of sanctions against the Russian economy after evidence of war crimes in the Ukrainian city of Bucha. It is expected that the new restrictions will affect the import of coal for 4 billion euros per year, as well as equipment for the gas industry, transport and other industries for 10 billion euros per year. The sanctions will also affect the ban on investment, in particular; it is planned to introduce new measures against financial institutions and state-owned enterprises, as well as a number of representatives of the Russian authorities and their families. The European Union will stop buying fertilizers, timber and a number of food products from Russia, which in the current realities is estimated at about 5.5 billion dollars a year. Imports of Russian oil, as well as natural gas, remain practically unchanged, since for many EU countries this is a fundamental issue of energy security. In particular, Germany and Hungary oppose a complete embargo. At the moment, the EU buys almost 40% of all gas and about 60% of oil and oil products from Russia.
Macroeconomic statistics from Europe published on Tuesday turned out to be restrainedly optimistic, but did not have a noticeable impact on the market. The Composite Manufacturing PMI in the eurozone in March rose from 54.5 to 54.9 points with a neutral forecast. The Services PMI for the same period increased from 54.8 to 55.6 points, while analysts did not expect any changes here either.
Bollinger Bands in D1 chart demonstrate a moderate decrease. The price range is expanding, but at the moment it is not keeping up with the surge of "bearish" sentiment. MACD is going down preserving a stable sell signal (located below the signal line). Stochastic retains stable downward direction but is located in close proximity to the zero level, which indicates the risks of oversold euro in the ultra-short term.
Resistance levels: 1.0957, 1.1, 1.1051, 1.11 | Support levels: 1.09, 1.086, 1.08, 1.0767
Solid ECN, a True ECN Broker
Apr 06, 2022 at 16:31
Membro Desde Dec 08, 2021
325 posts
S&P 500, the US market is correcting
The US stock market continues to evaluate the recent revision of financial forecasts from leading analytical agencies. The day before, analysts at UBS Group AG raised the target price of Meta Platforms Inc. shares for Q2 2022 from 280 to 300 dollars. In turn, Chevron Corp., according to UBS Group AG estimates, will rise from 150 to 192 dollars. Prior to this, Goldman Sachs Group analysts also raised their forecast for the issuer's shares.
The US bond market is currently experiencing active growth: the rate of return on 10-year Treasury bonds rises by 2.44% and by 1.89% on conservative 20-year ones. More dynamic growth is traditionally demonstrated by short-term assets: annual bonds grow by 2.55%, and 6-month bonds rise by 4.26%.
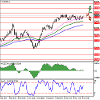
The index quotes are traded in a local uptrend, having overcome the resistance line of the lateral channel the day before. Technical indicators are holding a local buy signal: fast EMAs on the Alligator indicator are above the signal line, and the AO oscillator histogram is in the buy zone.
Support levels: 4470.0, 4216 | Resistance levels: 4630, 4800
Solid ECN, a True ECN Broker

*Uso comercial e spam não serão tolerados, podendo resultar no encerramento da conta.
Dica: Postar uma imagem/URL do YouTube irá incorporá-la automaticamente no seu post!
Dica: Insira o sinal @ para preencher automaticamente um nome de utilizador que participe nesta discussão.


