




Kicking Technical Analysis Patterns Technical Analysis Patterns
Kicking Candlestick Definition
The Kicking Candlestick Pattern is a two-candlestick formation that indicates a strong trend reversal. The pattern forms when a long black (bearish) candlestick is immediately followed by a long white (bullish) candlestick. Both candlesticks should have no overlapping shadows.
The long black candlestick indicates a strong bearish trend, while the long white candlestick represents a bullish trend. The pattern is named "kicking" because it signifies that a strong bearish trend has "kicked" off a strong bullish trend.
Is the Kicking Candlestick Bullish or Bearish?
The Kicking candlestick pattern can be both bullish and bearish.
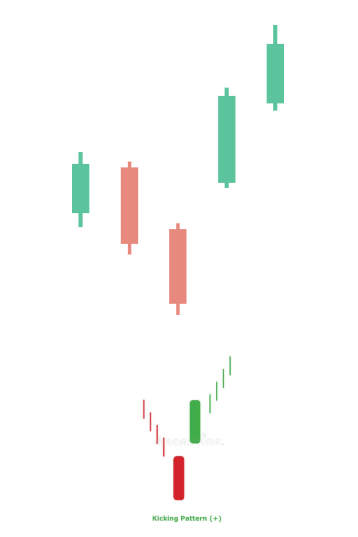
A bullish Kicking pattern occurs during a downtrend and is characterized by a large bearish candle followed by a gap up and a large bullish candle. The pattern suggests a strong bullish reversal, as the buyers were able to push the price up sharply, gapping above the previous day's high, and indicating a shift in market sentiment from bearish to bullish.
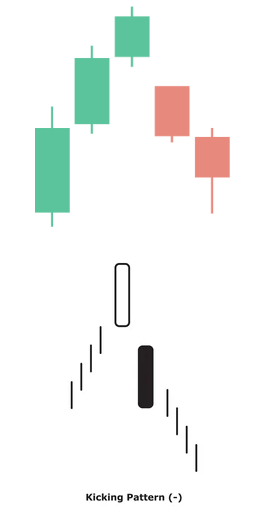
A bearish Kicking pattern occurs during an uptrend and is characterized by a large bullish candle followed by a gap down and a large bearish candle. The pattern suggests a strong bearish reversal, as the sellers were able to push the price down sharply, gapping below the previous day's low, and indicating a shift in market sentiment from bullish to bearish.
Kicking Candlestick in Up and Down Trends
In an uptrend, the Kicking Candlestick Pattern may be a bearish continuation pattern. The pattern forms when a long white candlestick is followed by a long black candlestick. The long black candlestick indicates that the bears are gaining control, and the uptrend may be ending.
In a downtrend, the Kicking Candlestick Pattern is a bullish reversal pattern. The pattern forms when a long black candlestick is followed by a long white candlestick. The long white candlestick indicates that the bulls are taking control, and the downtrend may be ending.