Edit Your Comment
Typical Price Congestion on the daily Chart
Sep 01, 2022 zamanından beri üye
24 iletiler
Mar 14, 2024 at 15:39
Sep 01, 2022 zamanından beri üye
24 iletiler
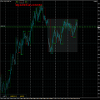
This is a typical congestion, where prices bounce back at the high of the measuring bar.
NZD/CHF - daily chart, congestion with 12 bars.
On the chart the daily congestion is displayed on the 4 hr chart.
There are blocks around each daily chart bar.
NZD/CHF - daily chart, congestion with 12 bars.
On the chart the daily congestion is displayed on the 4 hr chart.
There are blocks around each daily chart bar.
A little bit of knowledge is a dangerous thing!
Sep 01, 2022 zamanından beri üye
24 iletiler
Mar 15, 2024 at 12:16
Sep 01, 2022 zamanından beri üye
24 iletiler
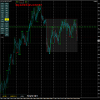
NZD/CHF - daily congestion with 13 bars today.
as so many times, prices trade back into the congestion between bar 11 and bar 17.
Again displayed on the 4 hr chart, showing the congestion high/low of the daily (red lines) surrounded by blocks to show what 4 hr bars belong to the daily bar.
as so many times, prices trade back into the congestion between bar 11 and bar 17.
Again displayed on the 4 hr chart, showing the congestion high/low of the daily (red lines) surrounded by blocks to show what 4 hr bars belong to the daily bar.
A little bit of knowledge is a dangerous thing!
Sep 01, 2022 zamanından beri üye
24 iletiler
Mar 15, 2024 at 14:13
Sep 01, 2022 zamanından beri üye
24 iletiler
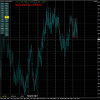
NZD/CAD - daily congestion with 13 bars
this pair, if in a SELL position, should not be traded more than max. 12.5% below the length of measuring bar. (approx 12 pips below the red line)
The measuring bar is approx 100 pips long.
this pair, if in a SELL position, should not be traded more than max. 12.5% below the length of measuring bar. (approx 12 pips below the red line)
The measuring bar is approx 100 pips long.
A little bit of knowledge is a dangerous thing!

*Ticari kullanım ve istenmeyen e-postalara müsamaha gösterilmez ve hesabın feshedilmesine neden olabilir.
İpucu: Bir resim/youtube urlsi yayınlamak, onu otomatik olarak gönderinize gömer!
İpucu: Bu tartışmaya katılan bir kullanıcı adını otomatik olarak tamamlamak için @ işaretini yazın.


