- Início
- Comunidade
- Traders Experientes
- Forecasts And Trade Ideas FX Currencies and Commodities
Advertisement
Edit Your Comment
Forecasts And Trade Ideas FX Currencies and Commodities
Membro Desde Feb 08, 2018
40 postagens
Mar 17, 2019 at 11:07
Membro Desde Feb 08, 2018
40 postagens
EURUSD Forecast: A week of 90 pips as the result of Brexit optimism, not a self-strength.
The summary of the past week: A week of 90 pips as the result of Brexit optimism, not a self-strength.
Fundamental Analysis:
USD ended the week lower against all of the major currencies on the back of softer economic data. DXY ended the week at 95.88.
After the mixed employment report released in the previous week, and weaker-than-expected US data released throughout the week. US CPI increased by 1.5% YoY in February, while the core reading printed 2.1%, below the previous estimate of 2.2%, slightly below the market’s expectations. Inflation at factory levels also increased by less-than-expected according to the PPI figures, while Durable Goods Orders were mixed, as the headline reading was better-than-expected, but the ex-transportation sub-component was a miss. And New Home Sales decreased by 6.9% in January vs. an expected 0.6% decline. Instead of improving, the Empire State Manufacturing Index dropped to a 22-month low in March while industrial production grew less than expected. The University of Michigan Consumer Sentiment index increased but the improvement also fell short of expectations.
In response, Treasury yields turned lower and the dollar headed south.
Things in the EU were not much better, although there were not many relevant releases. German inflation was also softer-than-expected up by just 1.5% YoY. Eurozone Data is still not promising.
EURUSD gains were the result of Brexit optimism, as GBP rally added pressure on USD. Nevertheless, investors can’t find a reason to go long in the EUR, leaving the pair confined to the range established in the previous week.
Slowing global economic growth, contradictory headlines related to the US-China trade war, and Brexit chaos, were behind the absence of a clear trend.
Money is looking for a place to go. One of the primary reasons why the dollar outperformed in the first quarter is relative weakness abroad but as some big uncertainties subside, money could flow back into riskier currencies and riskier assets.
GBP: The UK still doesn’t have a Brexit deal but at least we know that they won’t be spinning-out without an agreement.
CHINA: Slower growth in China has been a big problem for the rest of the world but tax cuts could provide a big boost to the economy.
The prospect of improvements could make other investments more attractive, easing demand for US dollars even as the US economy outperforms. However, in the long term, demand for USD should remain strong as the Fed continues to be the only major central bank to raise interest rates this year. ( BoE may join FED depending on Brexit )
We have an interesting week ahead: The FED and BOE Interest Rate Decision and Monetary Policy Statement.
Some analysts believe that “low inflation” will lead FED to take more Dovish stance. However, the latest comments of FED members was putting it straight. ” Inflation would not be the FED’s main concern anymore ”
The FED isn’t expected to make fundamental changes to its monetary policy, with attention shifting to the dot-plot and any revision to future rate moves. Market players believe that at least one rate hike is still in the docket for this year. More relevant the Fed will offer new forecasts on inflation and growth, following the December update. Back then, the central bank reduced chances of rate hikes from three to two, but ever since then, the dovish ‘patient’ stance has dented hopes of such happening.
On the Euro Side: The most relevant macroeconomic data will be the German ZEW survey, expected to show that Economic Sentiment deteriorated further in the Union, and preliminary March Consumer Confidence. By the end of the week, preliminary Markit PMI for both economies will be out. EU numbers posted a modest bounce in February, but not enough to spoke the ghost of slowing economic growth. As long as Eurozone data remains unpromising with all aspects, the EUR has no chances of posting solid gains against USD.
Summary: We are talking about EURO vs USD. There are two legs of this equation. On the one side, there is FED continues to be the only major central bank to raise interest rates this year. On the other side, there is a slowing down economy and continuous unpromising macroeconomic figures. Under the current macroeconomic fundamental conditions, EURUSD can not have a sustainable ” bullish ” move. All temporary bullish moves will be used as a selling opportunity by the investors.
Technically:
I will not add any indicators on to the chart. The picture and the levels are clear enough. The pair has been trading in a descending channel for two months.
On the upside, the key resistance resides at 1.13600. A firm break and close above 1.13600 would send the pair 1.14200 and 1.14800.
The pair has attempted several times to break above 1.13300, although it failed to sustain gains above it. In the weekly chart, the price is now just below a directionless 200 SMA, while the 20 and 100 SMA remain above the larger one.
We can say that EURUSD is in a ” No Trade Zone” as the technical indicators in the mentioned chart offer a neutral stance, heading nowhere right below their midlines, with the risk still skewed to the downside in the longer run.
On the downside, the levels that Bulls will try to defend are 1.12900 and 1.12600. Breakout of 1.12600 will trigger the bearish move.
On the smaller charts, a bearish Butterfly Pattern is in action. – Area of the entry 1.1344-1.13520- The pattern has reached its structural targets.
Our trading strategy is to sell the bullish attempts towards 1.13600. We have published a triangle pattern on Friday and we plan to add short at the breakout of the triangle 1.12900.
Closing above 1.13600 can be used as a buying opportunity with the targets 1.14200 and 1.14800 shorter-term.
We will publish the fresh trade setups for the members as soon as they appear on the charts.
Membro Desde Mar 18, 2019
97 postagens
Mar 18, 2019 at 13:56
Membro Desde Mar 18, 2019
97 postagens
itradeandwin posted:
Asia Overview by Reuters:
The dollar index was down 0.1 percent at 90.359. The index has risen 0.4 percent this week.
Treasury debt prices gained and yields declined as investors sought the safety of government bonds.The 10-year Treasury note yield fell 2 basis points to 2.811 percent, pulling back from Thursday’s nine-day high of 2.838 percent.
Trump said late on Thursday that he had instructed U.S. trade officials to consider $100 billion in additional tariffs on China, fuelling the trade dispute between the world’s two economic superpower
Traders are focused on NFP. Considering USD’s recent strength, investors are positioning for a stronger labour-market number but there’s also plenty of room (in wage growth and the jobless rate) for a downside surprise, which makes trading NFP this month particularly difficult.
Technical Analysis and Key Levels:
We want to keep it simple for you. As shown in the H4 Chart:
EURUSD is below EMA 50, 100 and EMA 200. Golden Cross is very close. RSI is oversold. However, in the daily chart, RSI has room downside.
The main resistance zone – orange coloured- is 1.23000 – 1.23300. Above the resistance zone, 1.23600 will be the key level for the continuation of the upside move.
Below the current level, 1.22080 – 1.21780 ( Red Coloured ) zone is the main support. Break below this support will carry the price 1.21090 – 1.20900.
1.20900 was the breakout of the bullish triangle. 450 pips bullish move had started after the breakout of 120900. This level is likely to play a key support role. If EURUSD breaks below 1.20900, we can start to speak about a trend reversal and 1.17000.
helpful, thank you so much for sharing
Membro Desde Feb 08, 2018
40 postagens
Jun 24, 2019 at 06:05
Membro Desde Feb 08, 2018
40 postagens
XAUUSD Gold Technical Overview H4 Chart
Date: 06-24-2019
Time: Pre Asia
H4 Chart Overview is updated prior to London and New York Opening.
This is just a technical summary of the said pair/instrument on the mentioned chart timeframe.
Please note that the fundamentals and Economic Calendar Data Flow may have a strong impact.
Current Value: 1398.89
Technical Indicators
RSI(14) 69.824 Bullish
STOCH(9,6) 72.904 Bullish
STOCHRSI(14) 50.408 Neutral
MACD(12,26) 15.530 Bullish
ADX(14) 54.050 Bullish
Williams %R -16.786 Overbought
CCI(14) 88.4942 Bullish
ATR(14) 12.9143 High Volatility
Highs/Lows(14) 16.0392 Bullish
Ultimate Oscillator 56.371 Bullish
ROC 4.033 Bullish
Bull/Bear Power(13) 31.4900 Bullish
Buy: 9 Sell: 0 Neutral: 1
Summary: STRONGLY BULLISH
Moving Averages:
SMA12: 1390 / Bullish
SMA 20: 1374 / Bullish
EMA 50: 1358 / Bullish
SMA 100: 1337 / Bullish
SMA 200: 1312 / Bullish
The first Moving Average Resistance:
The first Moving Average Support: 1390 SMA 12 1375 SMA50
Summary: Price is above all main Moving Averages. Strong Bullish. Potential pullbacks towards 1375 SMA 50 can be used as a buying opportunity.
Bollinger Bands Readings
Bollinger Bandwidth(20): 90.66
Bollinger Bands %b(20:2): 55.2869
Summary: Gold is trading in the upper channel of BB. Bullish. Bandwidth does not send a clear reversal/retracement signal. Next two H4 Candles may give us a better view.
Ichimoku Readings:
Senkou Span A: 1342
Senkou Span B: 1339
Tenkan-sen Kijun-sen: Bullish
Ichimoku Summary: Tenkan-sen support 1395.71. Break below may send the price 1390 and 1382.
Support / Pivot / Resistance
S1 S2 S3 P R1 R2 R3
Classic 1383.09 1387.97 1393.89 1398.77 1404.69 1409.57 1415.49
Fibonacci 1387.97 1392.10 1394.64 1398.77 1402.90 1405.44 1409.57
Camarilla 1396.83 1397.82 1398.81 1398.77 1400.79 1401.78 1402.77
Woodie’s 1383.61 1388.23 1394.41 1399.03 1405.21 1409.83 1416.01
Murrey Math Calculations ( Support / Pivot / Resistance ):
Upside Levels: 1406.25 MM 6/8 Major Pivot Reverse 1421.88 MM 7/8 Weak Stall Reverse 1437.50 MM 8/8 Ultimate Resistance
Downside Levels: 1390.63 MM 5/8 Hourly Support 1375.65 MM 4/8 Major Support
Summary: Potential price movements towards 1421-1430 can be used as a selling opportunity. Potential pullbacks towards 1375 SMA 50 can be used as a buying opportunity. H4 Closing below 1375 could send the price 1359.
Divergence ( Regular / Hidden)
RSI: None
MACD: None
OSMA: None
STOCHASTICS: None
AWESOME: None
CCI: Bearish Divergence / Confirmed – Signal 2 candle before –
Candle Patterns ( Confirmed Only )
Bearish Harami
Breakout and Harmonic Patterns
Symmetrical Triangle H1 Chart / Emerging Not Validated Yet
Double Top M30 Chart / Emerging Not Validated Yet
Bearish Butterfly Pattern D1 Chart / Pending Entry Starts @ 1420
Inverse Head and Shoulders M30 / Emerging Not Validated Yet
Technical Summary H4 Chart:
Bullish Scenario: XAUUSD may retest latest high @ 1412. If it breaks above 1412, it is likely to test 1421 resistance which is the area of the entry of the Bearish Butterfly on the Daily Chart. This level can be used as a selling opportunity.
Bearish Scenario: If Gold breaks below 1394, it is likely to test 1390 and 1386. Firm closings below 1389 could send the pair 1375 which can be used as a buying opportunity.
We have different emerging patterns on smaller chart timeframes.
All potential intraday trading opportunities will be sent to members.
The technical summary will be updated prior to the London Session.
Good Luck
Membro Desde Feb 08, 2018
40 postagens
Jun 30, 2019 at 07:14
Membro Desde Feb 08, 2018
40 postagens
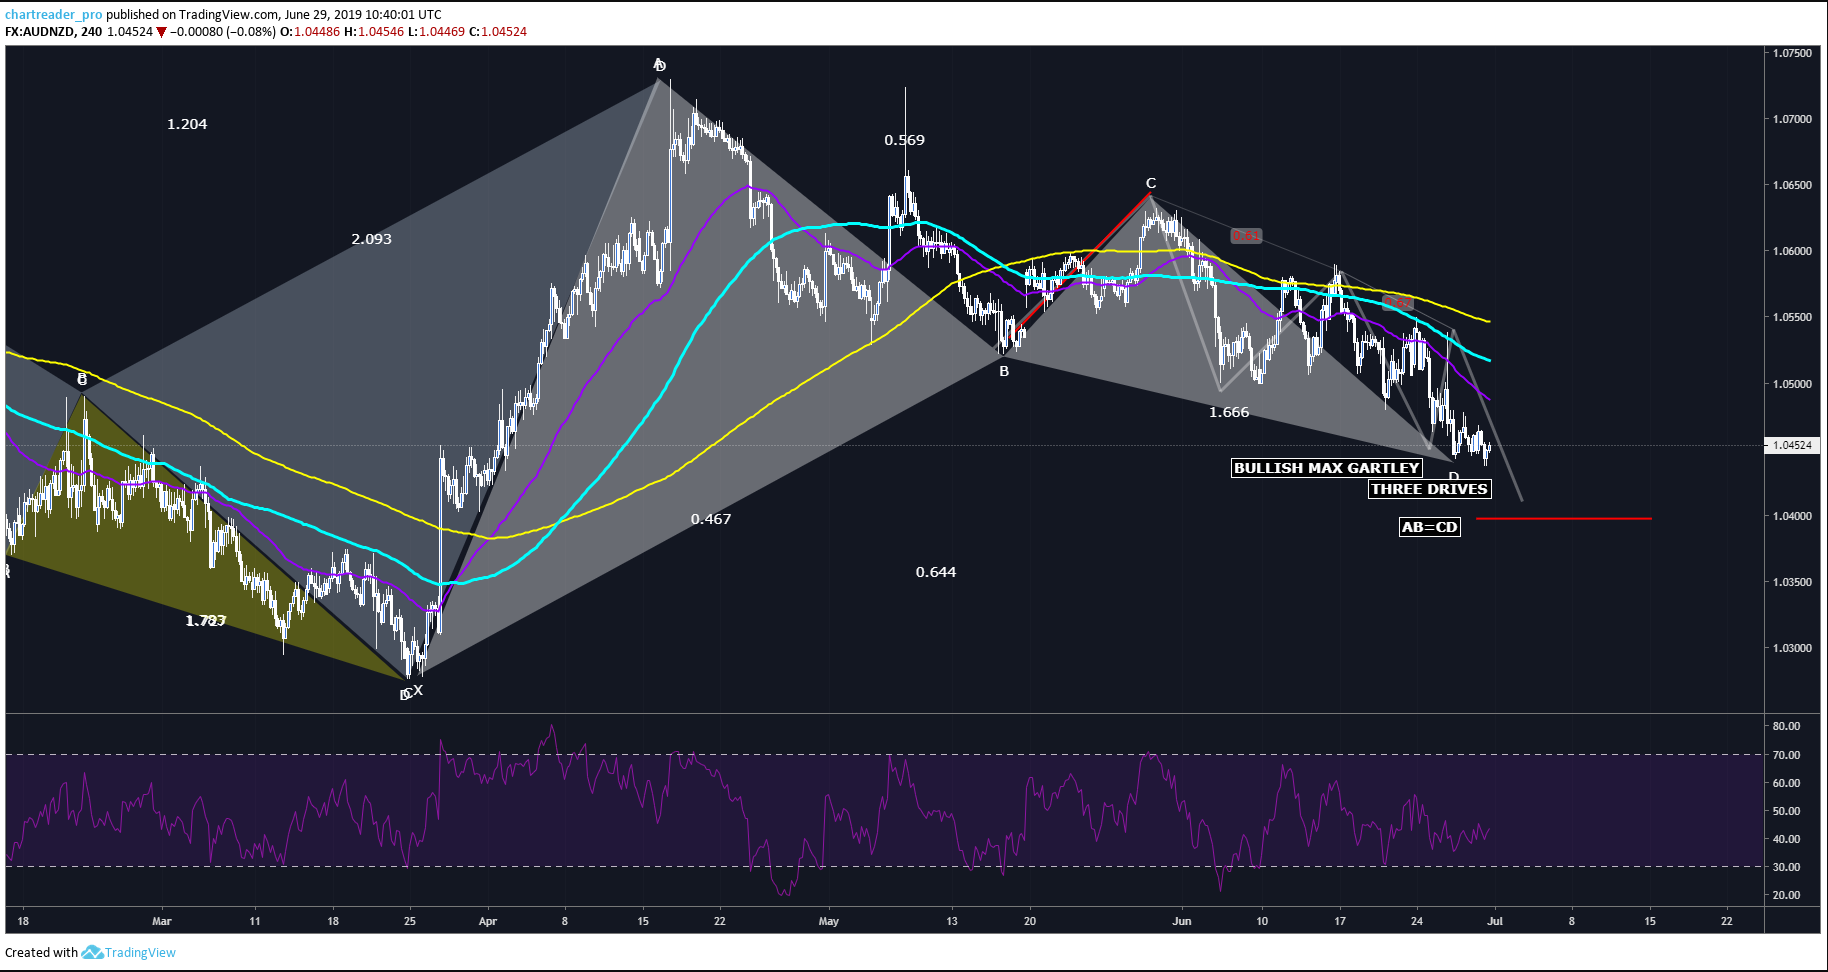
AUDNZD Harmonic Overview And Technical Analysis
Date: 06-29-2019
Daily Chart Overview is released prior to Asia Opening only.
To see the intraday overview/summary, please check H4 and H1 Overviews.
H4 Chart Overview is updated prior to London and New York Opening.
This is just a technical summary of the said pair/instrument on the mentioned chart timeframe.
Please note that the fundamentals and Economic Calendar Data Flow may have a strong impact.
Current Value: 1.04520
REMINDER: RBA Interest Rate Decision is scheduled to release on Tuesday, July 2nd. Market Expectations: 25 bp Rate Cut. Risk of High Volatility.
Technical Indicators Daily Chart
RSI(14) 35.153 Sell
STOCH(9,6) 30.538 Sell
STOCHRSI(14) 4.609 Oversold
MACD(12,26) -0.003 Sell
ADX(14) 36.392 Sell
Williams %R -87.382 Oversold
CCI(14) -167.5981 Sell
ATR(14) 0.0051 Less Volatility
Highs/Lows(14) -0.0037 Sell
Ultimate Oscillator 40.100 Sell
ROC -0.802 Sell
Bull/Bear Power(13) -0.0096 Sell
Buy: 0 Sell: 9 Neutral: 0
Summary: STRONGLY BEARISH
Indicators Summary: The trend is bearish. RSI has downside rooms. We may see a minor retracements intraday as some oscillators are oversold. Pullbacks are selling opportunities.
Moving Averages Daily Chart:
MA5 1.0473
MA12 1.0497
MA20 1.0521
MA50 1.0557
MA100 1.0522
MA200 1.0530
Summary: Price is below all main Moving Averages. Strongly Bearish
The first Moving Average Resistance: 1.04800 – 1.04900 ( EMA50 H4, SMA100 D1)
The first Moving Average Support:
A pullback towards 1.04800 is selling opportunity.
Bollinger Bands Readings Daily Chart
Bollinger Bandwidth(20): 0.0153
Bollinger Bands %b(20:2): 16.8185
Summary: Price is testing the lower BB. A minor retracement is predicted.
Ichimoku Readings:
Senkou Span A: 1.05930
Senkou Span B: 1.05290
Tenkan-sen Kijun-sen: Bearish
Ichimoku Summary: The price is well below the cloud. Tenkan-Sen & Kijun-Sen are sliding below the cloud as well. 1.04940 can be used as a selling opportunity.
Support / Pivot / Resistance Daily Chart
NAME S3 S2 S1 PIVOT POINTS R1 R2 R3
Classic 1.0402 1.0422 1.0437 1.0458 1.0473 1.0494 1.0509
Fibonacci 1.0422 1.0436 1.0444 1.0458 1.0472 1.0480 1.0494
Camarilla 1.0442 1.0445 1.0449 1.0458 1.0455 1.0459 1.0462
Woodie’s 1.0398 1.0420 1.0433 1.0456 1.0469 1.0492 1.0505
Murrey Math Calculations ( Support / Pivot / Resistance ):
Upside Levels:
1.04670 MM 3/8 H4 1.04980 MM 4/8 D1 Resistance
Downside Levels:
1.04370 MM 2/8 H4 Support 1.04060 MM 1/8 Weak, Stall&Reverse 1.03760 MM 0/8 Major Support
Summary: Bearish Below 1.05590
Divergence ( Regular / Hidden)
RSI: Bullish Divergence H4
MACD: None
OSMA: Bullish Divergence H4
STOCHASTICS: Bullish Divergence H4
AWESOME: None
CCI: None
Candle Patterns ( Confirmed Only )
Engulfing Bullish H4 June 28 04:00
Breakout and Harmonic Patterns
Bullish Max Gartley H4 & D1 1.04390
Bullish Three Drives H4 & D1 1.04100
Bullish AB=CD H1 1.04030
Head & Shoulders H4: In Construction
Inverse Head & Shoulders H1: In construction
Technical Summary:
Divergences and Overbought Oscillators confirm and support the harmonic patterns as mentioned above. However, the strong bearish indicator readings recommend using potential pullbacks as selling opportunities. Stong support resides @ 1.03760. RBA Interest rate decision will determine the next direction of the pair.
Membro Desde Feb 08, 2018
40 postagens
Jul 07, 2019 at 13:40
Membro Desde Feb 08, 2018
40 postagens
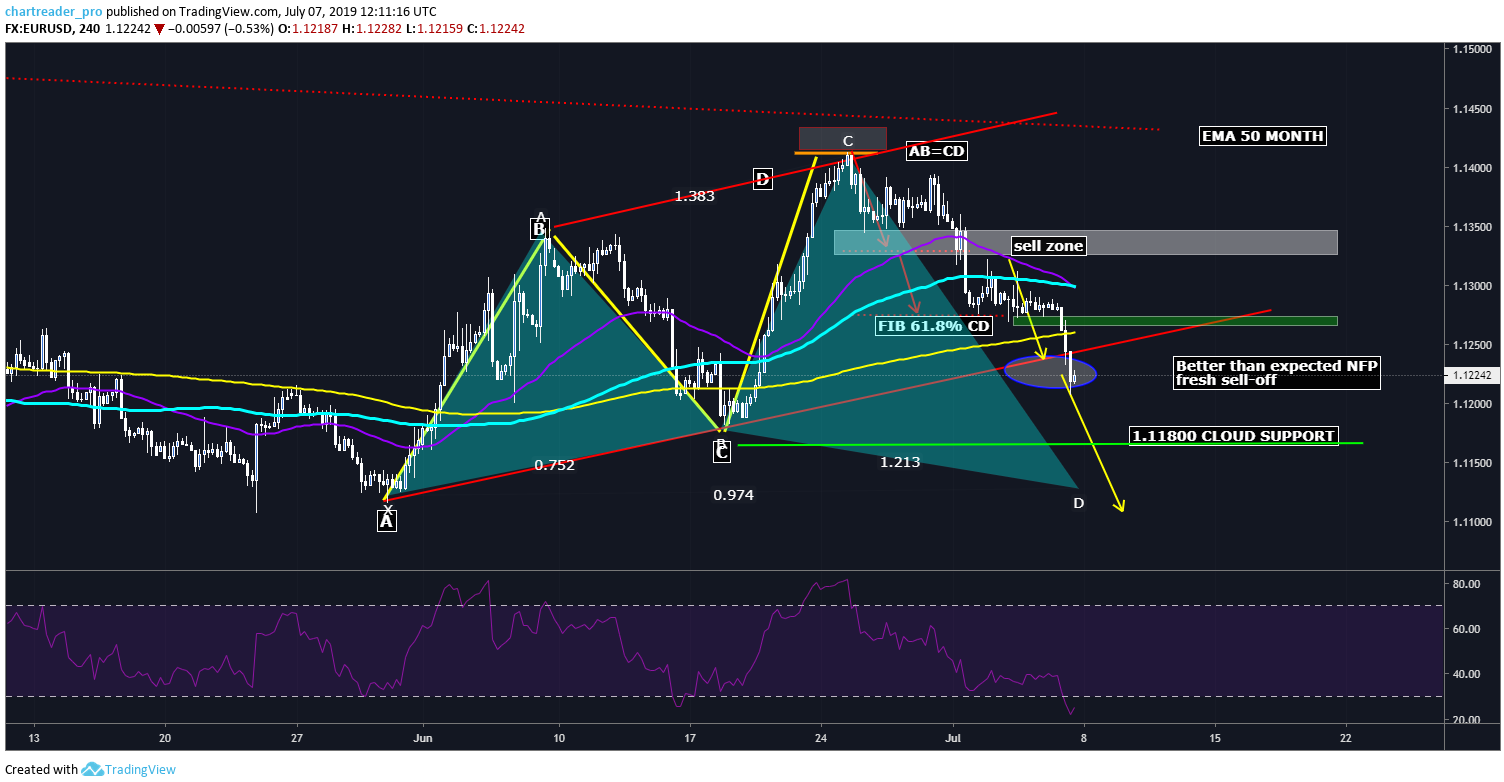
EURUSD Forecast and Technical Analysis Week July 8-12
Fundamental Forecast
After Friday’s Non-Farm Payrolls Reports, USD Bulls regain the control. On the other side, the unemployment rate increased and most importantly wage growth held steady at 0.2% instead of rising to 0.3% like economists anticipated.
The dollar index broke the critical resistance. The reason for the Dollar’s rally despite the FED’s shift to a dovish bias is clear: The U.S. economy is stronger than its peers.
The upcoming week will bring more clarity about the Fed’s path. Powell is due to testify before the Congress, while the central bank will release the Minutes of its latest meeting. The US will also publish CPI data for June, with core inflation seen steady at 2.0%.
Dollar Bears approach is different. They believe that job report reduces the need for an immediate interest rate cut, but it doesn’t eliminate it. Nearly half of the members of the FOMC feel that easing is necessary this year and they won’t be swayed by a mixed jobs report and this week’s FOMC minutes should remind us of the extent of the central bank’s dovishness. Their concerns center around trade and inflation and while the US and China agreed to restart trade talks at G20, only time will tell whether the progress is real.
On the other side, the latest Germany Factory orders data proved that the slow down in the Eurozone economy is not temporary. The ECB is likely to take more easing actions including a rate cut.
The FED is now expected to cut rate just once this year by 25bps, as a “preventive” move. Concerns about a global economic slowdown are still driving the financial world, but the US continues being the strongest ring of the chain. As long as the market keeps believing that the Fed will pull the trigger just once this year, the dollar will likely keep rallying.
Now its in Powell’s hands. Whether the pair could break lower will depend solely on Powell. Will he maintain its confident outlook and down talk chances of aggressive rate cuts. I bet on it 95%.
Technical Overview
The pair ended the week at 1.12240.
Technical Indicators of the Daily Chart
RSI(14) 42.747 Sell
STOCH(9,6) 40.562 Sell
STOCHRSI(14) 0.000 Oversold
MACD(12,26) 0.002 Buy
ADX(14) 33.633 Sell
Williams %R -80.687 Oversold
CCI(14) -89.9675 Sell
ATR(14) 0.0060 Less Volatility
Highs/Lows(14) -0.0055 Sell
Ultimate Oscillator 34.803 Sell
ROC 0.071 Buy
Bull/Bear Power(13) -0.0107 Sell
Summary: Strong Bearish. RSI has downside rooms.
Moving Averages Daily Chart
Summary: Strongly Bearish. The Golden Cut is being printed.
The first MA Resistance: 1.1255 SMA 100 Daily
The first MA Support: Downside is empty.
Murrey Math Calculations ( Support / Pivot / Resistance for Monday )
Upside Levels:
1.12650 MM 1/8 Weak, Stall, Reverse 1.12910 MM 2/8 Major Pivot Resistance 1.13200 MM 3/8 Top of the Trading Range
Downside Levels:
1.12000 MM 0/8 Overshoot, 1.11697 MM -1/8 Extremely Overshoot, 1.11400 MM -2/8 Bottom
Ichimoku Readings
Senkou Span A: 1.11750
Senkou Span B: 1.12770
Tenkan-sen Kijun-sen: Bearish
Ichimoku Summary: The price is inside the cloud. Cloud’s support is 1.117500 and breakout of the support will accelerate the sell-off. Cloud’s resistance is 1.1.12770 and pullbacks towards 1.12770 can be used as a selling opportunity.
Harmonic and Chart Patterns:
Ascending channel has been broken.
Emerging Bullish Cypher Pattern H Chart: 1.11170
Summary
Oversold RSI H Chart and Bollinger Bandwidth/Percentage confirm a minor retracement toward 1.12600 – 1.12800. This potential pullback can be used as a selling opportunity. Technically, the near term targets of the pair are 1.12000, 1.11800. Closing below 1.11700 would send the pair 1.11500 and 1.11200 medium terms.
We will update and send entry notification to members

Membro Desde Feb 08, 2018
40 postagens
Jul 14, 2019 at 07:03
Membro Desde Feb 08, 2018
40 postagens
EURUSD Forecast: Possible U.S. FX Intervention and Scenarios
What will determine the price of EURUSD Pair: Macroeconomic figures, monetary policies of the Central Banks or the lords of the currency wars?
Last week we saw similar articles and news in Bloomberg and Financial Times pointing out a possible U.S FX Intervention.
Bloomberg:
“The buzz around possible U.S. currency intervention is growing louder as Goldman Sachs Group Inc. has now weighed in on an idea that’s been making the rounds on Wall Street.
President Donald Trump’s repeated complaints about other countries’ foreign-exchange practices have “brought U.S. currency policy back into the forefront for investors,” strategist Michael Cahill wrote in a note Thursday. Against a fraught trade backdrop that’s created the perception that “anything is possible,” the risk of the U.S. acting to cheapen the dollar is climbing, he said.”
“Goldman joins analysts from banks such as ING and Citigroup Inc. in writing on the prospect. The intervention has become a hot topic since Trump tweeted last week that Europe and China are playing a “big currency manipulation game.” He called on the U.S. to “MATCH, or continue being the dummies.”
Buoyed in part by a round of Federal Reserve rate increases, the dollar has strengthened against many of its peers. A Fed trade-weighted measure of the greenback isn’t far below the strongest since 2002, underscoring the competitive headwinds American exports face overseas. Trump has grown concerned that the currency’s strength will undermine his economic agenda, which has also fed into his criticism of the U.S. central bank.
Still, in a tweet on Thursday, where Trump criticized Facebook Inc.’s plan for a digital currency, the president came out in support of the greenback, calling it “by far the most dominant currency anywhere in the world.”
The market has yet to display much concern about the prospect of U.S. intervention: Global currency volatility is at a five-year low. However, the risk of Trump moving beyond words to achieve a weaker greenback would increase if the European Central Bank pursues further monetary stimulus.
In in the intensifying currency war against the Eurozone (Germany), he will instruct the US Treasury (via the NY Fed) to intervene directly and unilaterally to drive the dollar lower.
This is not surprising. F.T summarized the case well: “Action to weaken the dollar is a ‘low but rising risk”
We will focus on 1.13600. Firm closings above 1.13600 can be the confirmation of U.S. FX Intervention. But we should not forget that ECB is ready for a Euro Intervention.
What will calendar bring us the upcoming week?
Tuesday: German ZEW Economic Sentiment, U.S. Retail Sales, U.S Production Data Set
Wednesday: Eurozone CPI, U.S Housing Data
Technically:
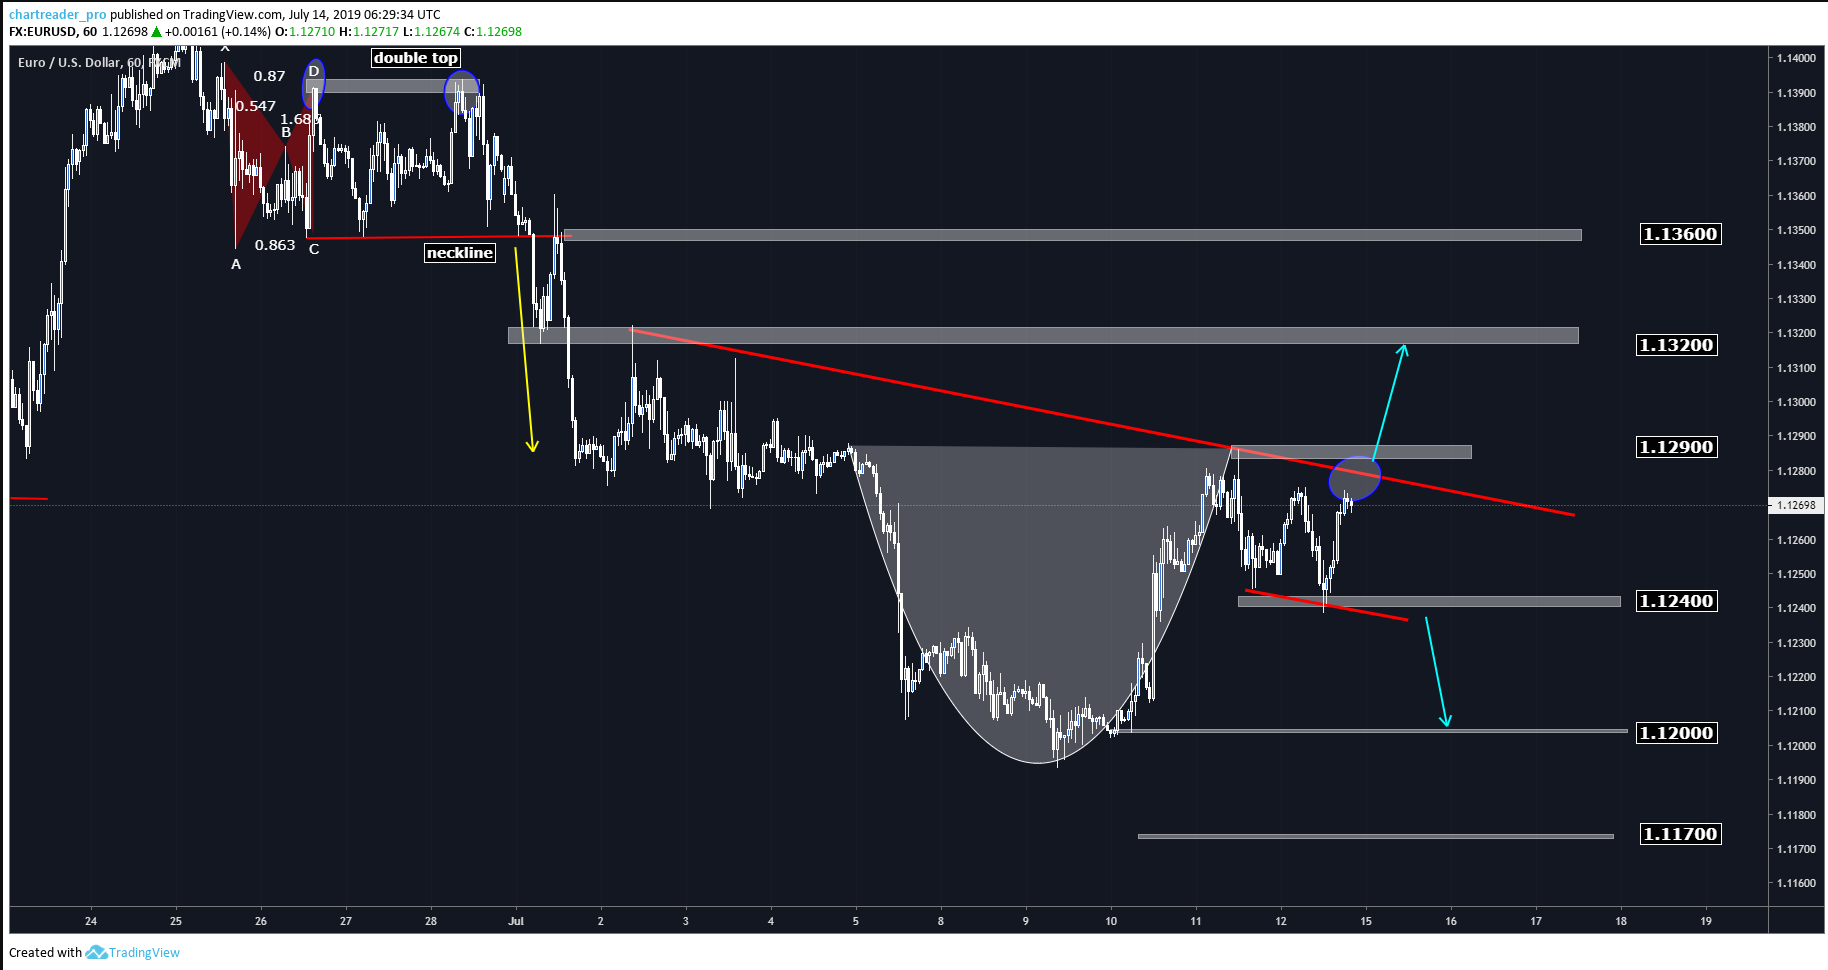
EURUSD ended the week at 1.12700 above MA50 H4 Chart. It is stuck in 80 pips trading range.
On the downside: 1.12400 is the key support and price will continue its bullish move as long as it maintains to stay above 1.12400. A firm closing below 1.12400 will send the pair 1.12000 and 1.11700.
On the upside: 1.12900 is the key resistance level. Break above 1.12900 will lead the pair toward 1.13200 and 1.13600.
On the smaller charts, we see an emerging Cup&Handle pattern. The ultimate target of the pattern is 80 pips.
Harmonic readings show two patterns. A bullish Bat Pattern at 1.12100 and a bearish White Swan pattern at 1.13500.
Now the pair is in NO TRADE zone. We will send entry notifications as soon as one of the patterns ( Breakout or Harmonic) become validated.

Membro Desde Feb 08, 2018
40 postagens
Jul 14, 2019 at 16:24
Membro Desde Feb 08, 2018
40 postagens
USDCAD Forecast: Retracement or Major Trend Change?
Fundamentals: Battle of the dovish Central Banks. BoC kept the interest rates benchmark unchanged and injected a maple dose of dovish rhetoric into the market. On the other hand; FED is prepared to cut interest rates soon despite record stock prices, low unemployment and core inflation above 2.0% because it’s worried about the economy. After 2,5 years Core CPI moved above UST10. That’s why Fed Chairman Jerome Powell isn’t really focused on the economy itself — it’s doing OK, actually. He’s nervous about what economists like to call internal or external “shocks.” A trade war certainly qualifies as one.
Rising Oil prices support the Canadian Dollar. The BoC is expected to end 2019 without a single rate move.
The Surprise Index has been clearly positive for Canada. It puts a large weight on headline employment and the unemployment rate. But as we showed last week, the quality of those job gains means the apparently tight labour market hasn’t translated into particularly strong consumer spending or GDP growth. Indeed, 2019 GDP estimates for Canada have actually fallen further below those for the US even with the “positive” data surprises.
Economic Calendar of USDCAD
Tuesday: U.S Production Data Set
Wednesday: U.S Housing Data, Canada CPI and Manufacturing Sales
Thursday: U.S Philadelphia FED Manufacturing Index, Canada ADP Non-Farm Employment Change
Friday: Canada Retail Sales
Weekly Chart: Bearish.
Loonie ended the week below SMA 20, EMA50, SMA200. SMA 100 support resides at 1.29700. Inside the Ichimoku Cloud. Cloud support at1.29500.
Daily Chart: Bearish.
The price is below all main Moving Averages.RSI is above 30 and has downside rooms. Murrey Math 2/8 Major Support resides @ 1.29390.
H4 Chart: Bearish
The price is below all main Moving Averages.RSI is above 30 and has downside rooms. Murrey Math – 2/8 Extremely Oversold resides @ 1.29700
Intraday Key Levels:
Upside: 1.30460 1.30610 1.30920
Downside: 1.30150 1.30000 1.29700
Chart Patterns:
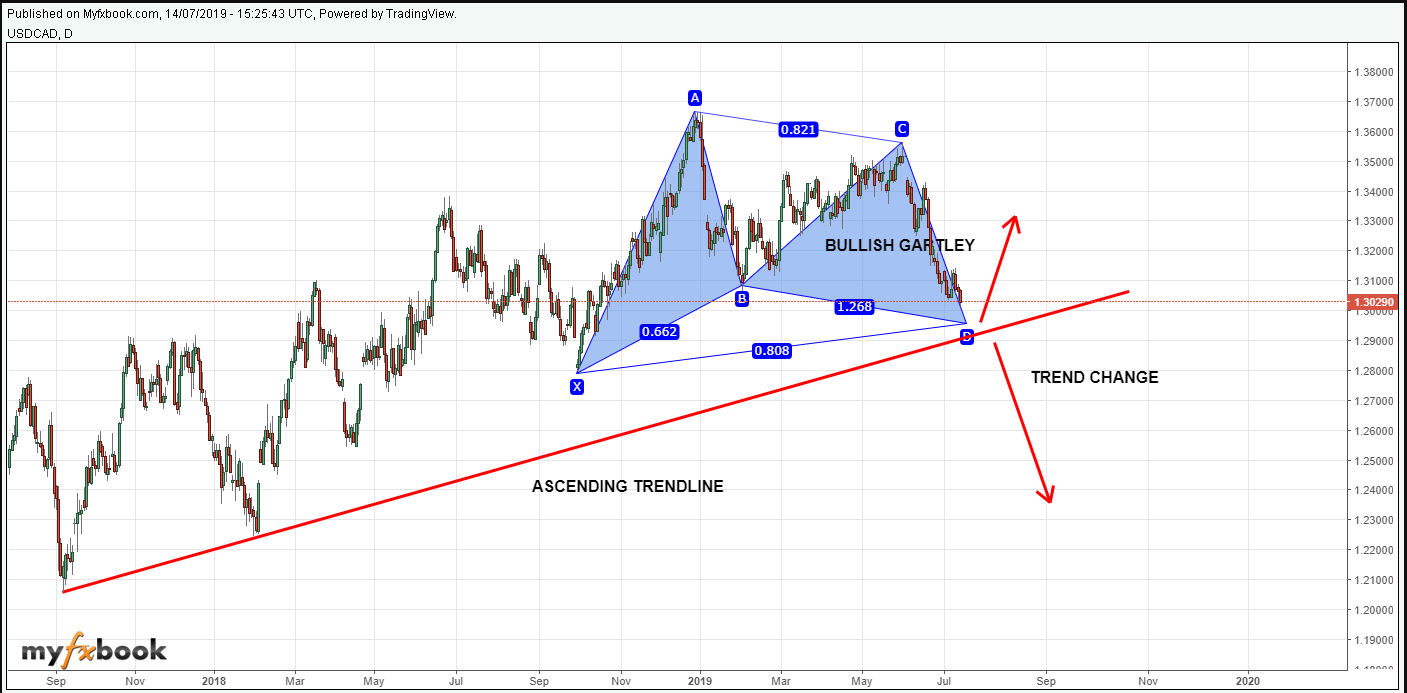
Daily Chart: Bullish Gartley and AB=CD patterns @ 1.29700
H1 Chart: Emerging Bearish Cypher Pattern @ 1.31200
Our Comments:
Break below 1.30150 could send the pair 1.29700. A potential breakout of the trend line and daily closing below 1.29500 would confirm the medium term trend change. 1.28170 will be the next target of the pair.
If the pair fails to break below 1.30150, it is likely to test 1.30900 resistance. However, the upside is capped by the SMA 100 H4 chart at 1.31200.
Medium Term Trade Opportunities:
Long Opportunity at 1.29700
Short Opportunity at 1.31200
We have published our near term trade plan for the members and we will send entry notifications.

Membro Desde Feb 08, 2018
40 postagens
Jul 21, 2019 at 04:55
Membro Desde Feb 08, 2018
40 postagens
USDCHF Technical Overview And Potential Long Opportunities
Market players focused on the FOMC Meeting and the FED’s interest rate decision in July.
FED officials signalled they are ready to lower interest rates by a quarter-percentage point later this month, while indicating the potential for additional reductions, despite the recent surge in market expectations of a half-point cut.
USDCHF ended the week 0.98160, 15 points above the physicological 0.98000 support.
Near term technical overview is still bearish.
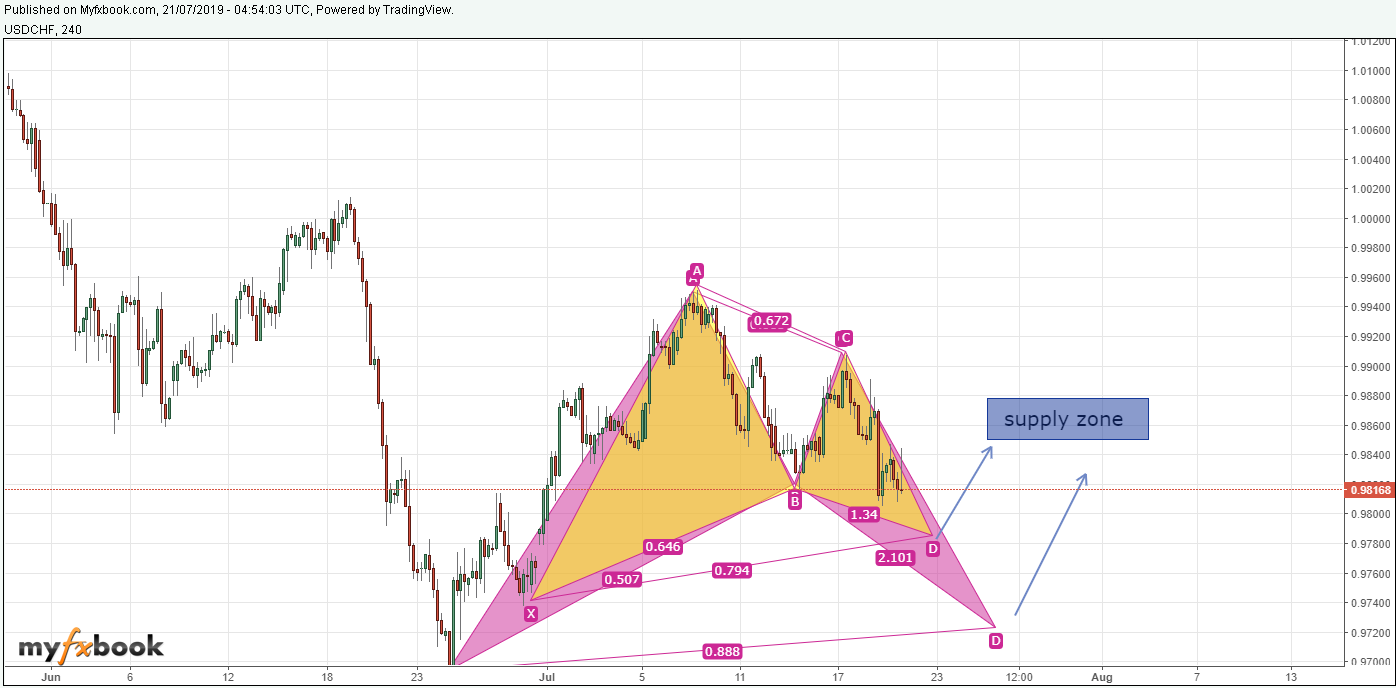
The upside is capped by SMA100 H4 & MM 2/8 at 0.98600 and SMA200 H4 at 0.98750. We see a Bearish Bat Pattern forming on the smaller charts which can be used as a selling opportunity. I will publish this pattern later.
USDCHF pair is likely to test 0.97940 on Monday. A clear breakout would send the pair 0.97660 support.
A Bullish Gartley ( 0.97600 ) and Bullish Bat Patterns ( 0.97350 ) are being printed on the H4 chart.
U.S Inflation expectations rose to 2.5% from 2.3% of historical lows. A one and done 25bp rate cut from the FED could support the U.S Dollar medium term.
The USDCHF pair may fill the Bat Pattern until FOMC statement. The emerging Bat pattern which would be completed in 0.97350 – 0.97250 regions can be used as a buying opportunity with medium-term purposes.

Membro Desde Feb 08, 2018
40 postagens
Jul 29, 2019 at 05:33
Membro Desde Feb 08, 2018
40 postagens
Crude Oil Forecast and Technical Analysis
The picture is not promising for Crude Oil Bulls.
The main problem is the Global Oil Demand.
Geopolitical risks and OPEC+ Supply Cut can not help oil prices because there is a lack of demand.
IMF lowered the Global Growth projections. IEA reduces its Oil Demand Growth projections.
In the near term, geopolitical risks can be the only reason for the bullish market. Saudi Arabia needs higher prices for Aramco’s IPO. But if there is no demand, cutting the supply could only a temporary solution which is not sustainable.
Technically:
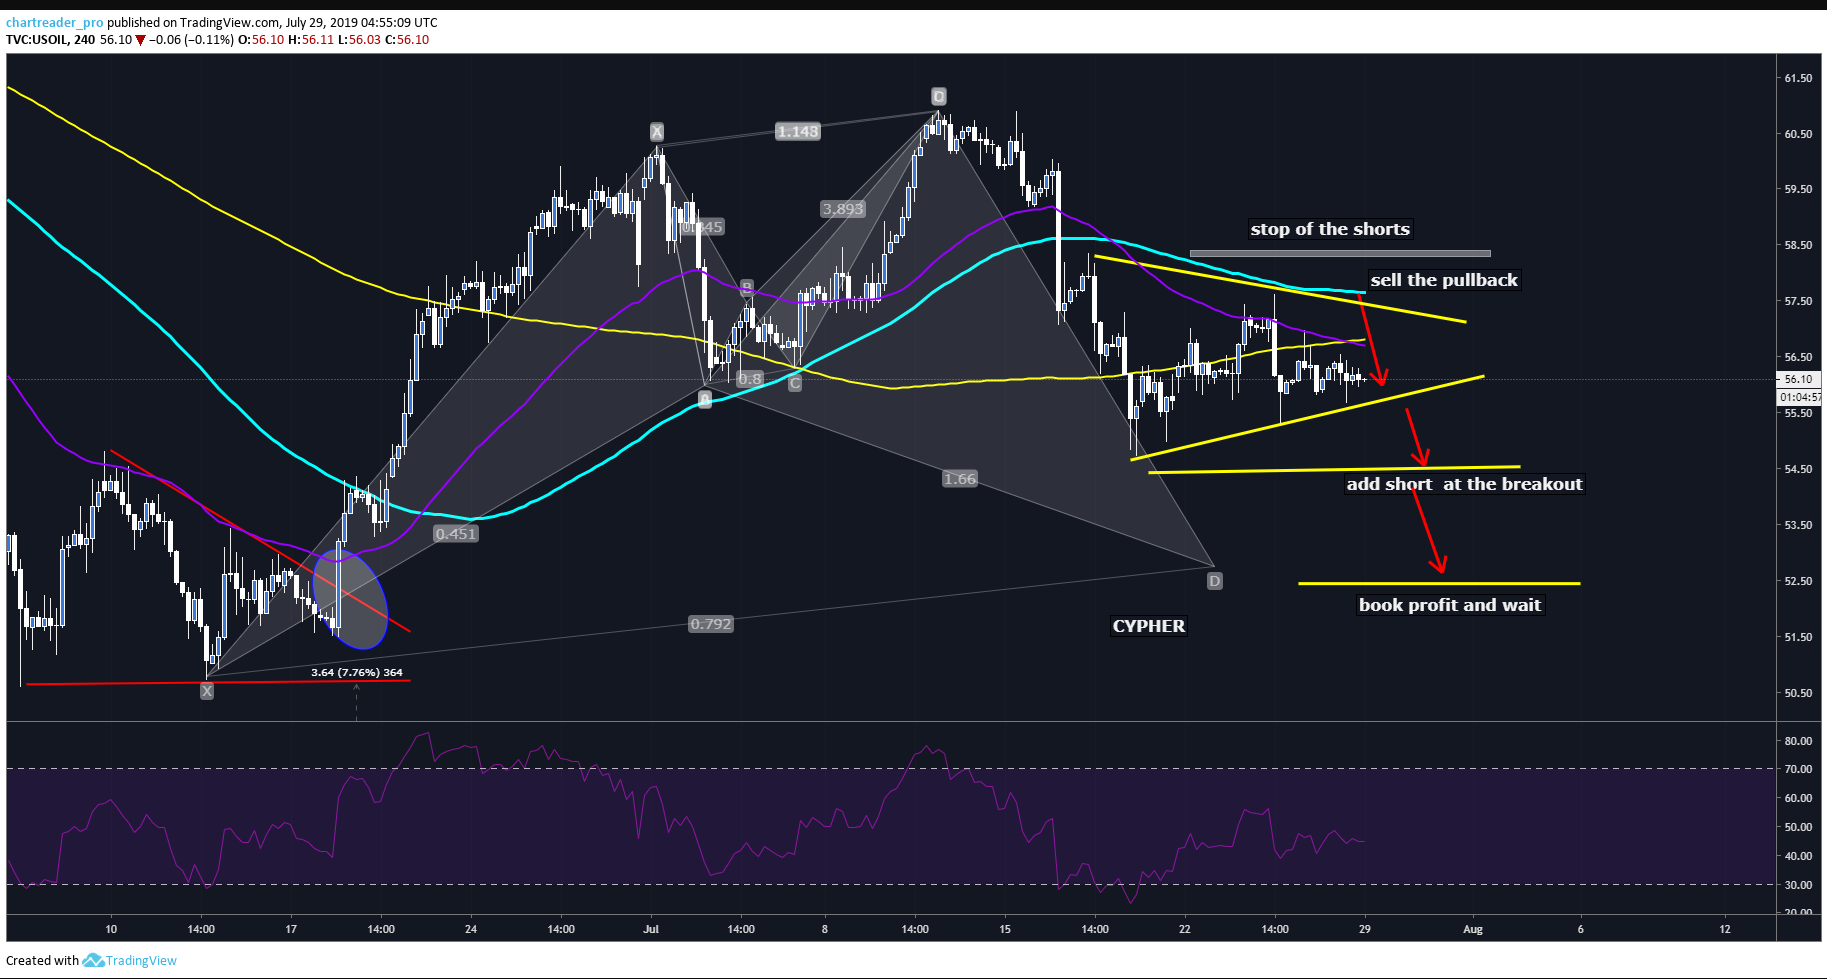
Near-term selling pressure remains as long as the prices stay below 58 $. Only a firm closing above 58 $ may change the near term overview and we may see the prices testing 59.40 $ – 60.00 $.
On the downside, we have two target levels: 55.40 $ and 54.70 $
Breakout of 54.70 will add weight on the prices and we could see 53 $ per barrel. At this level we expect the bulls to be more defensive.
We have a few patterns to trade intraday.
Our strategy is to sell the potential pullbacks and book profit at 53 $
Now we wait for the breakout to add short.

Membro Desde Feb 08, 2018
40 postagens
Oct 09, 2019 at 17:20
Membro Desde Feb 08, 2018
40 postagens
Membro Desde Feb 08, 2018
40 postagens
Oct 13, 2019 at 09:12
Membro Desde Feb 08, 2018
40 postagens
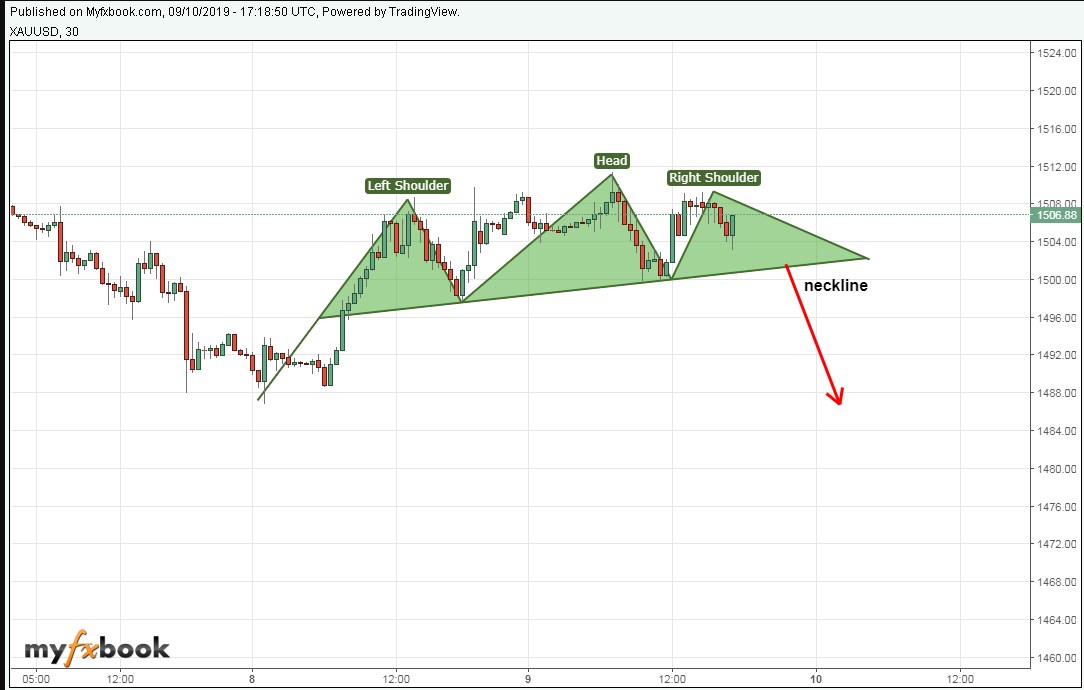
Trade Talk optimism, risk-off mode. Gold is likely to remain bearish near term.
Our XAUUSD Gold, DJI, and GBPJPY video analysis.
Our XAUUSD Gold, DJI, and GBPJPY video analysis.
Membro Desde Feb 08, 2018
40 postagens
Oct 20, 2019 at 07:51
Membro Desde Feb 08, 2018
40 postagens

AUDJPY and NZDJPY Overview: BoJ can cut short-term rates
While the markets were focusing on Brexit Vote in the UK Parliament, CB Governors continue to send “easing in monetary policies” messages via the IMF and World Bank’s 2019 Fall Annual Meetings of finance ministers and bank governors in Washington.
First, BoE’s Carney said Britain’s planned Brexit deal would help the country’s economy, but “almost existential” worries about global trade wars might prevent the BoE from raising interest rates.
Asked if securing a Brexit transition meant the BoE would resume raising rates, Carney said: “Not necessarily. I’m not going to pre-commit, there is a lot of contingencies there.”
He said the IMF had stressed the precarious nature of the world economy, which has prompted other central banks including the U.S. Federal Reserve and the European Central Bank to provide more stimulus.
Carney was followed by BoJ’s Governor Kuroda.
The Bank of Japan will “certainly” reduce short- to medium-term interest rates if it needed to ease monetary policy, Governor Haruhiko Kuroda said, suggesting that deepening negative rates will be the primary tool to fight to heighten overseas risks.
“If we need further easing of monetary conditions, we would certainly reduce short- to medium-term interest rates. But we don’t want to reduce super-long interest rates,”
Considering that other major CBs are planning to increase their easing policies – more rate cuts, asset purchases, etc. – the determining factor of the Japanese Yen’s position at this point is the Safe Haven phenomenon.
Keeping the Kuroda’s words in mind, let us take a look at the Asia-Pacific Crosses.
NZDJPY
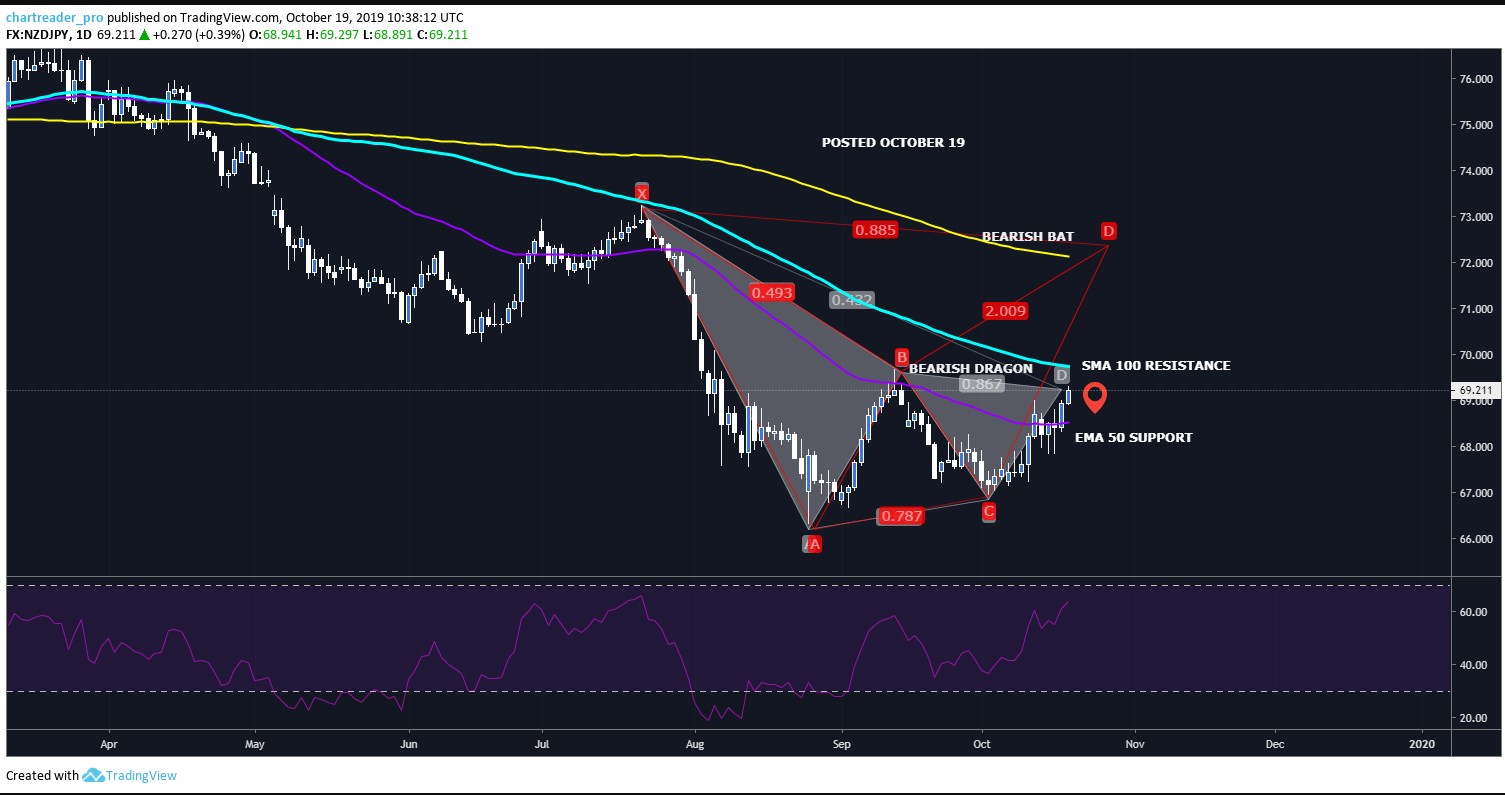
The pair ended the week above EMA 50 Days period at 69.21. RSI has upside rooms on the Daily Chart. The upside is capped by SMA100 at 69.80. Daily closing above 69.80 would send the pair towards 71.80 SMA200 resistance on the Dail Charts.
Bearish Dragon pattern is completed at 69.20 as seen on the above chart.
I have updated the Live Interactive H4 Chart. Following the Bearish Cypher pattern, the Bearish Shark Pattern would be completed at 69.35. This level can be used as a selling opportunity. However, the short-term bullish trend would remain unchanged as long as the price holds above 68.40.
All potential patterns and targets have been mentioned on the Live Interactive Charts.
AUDJPY

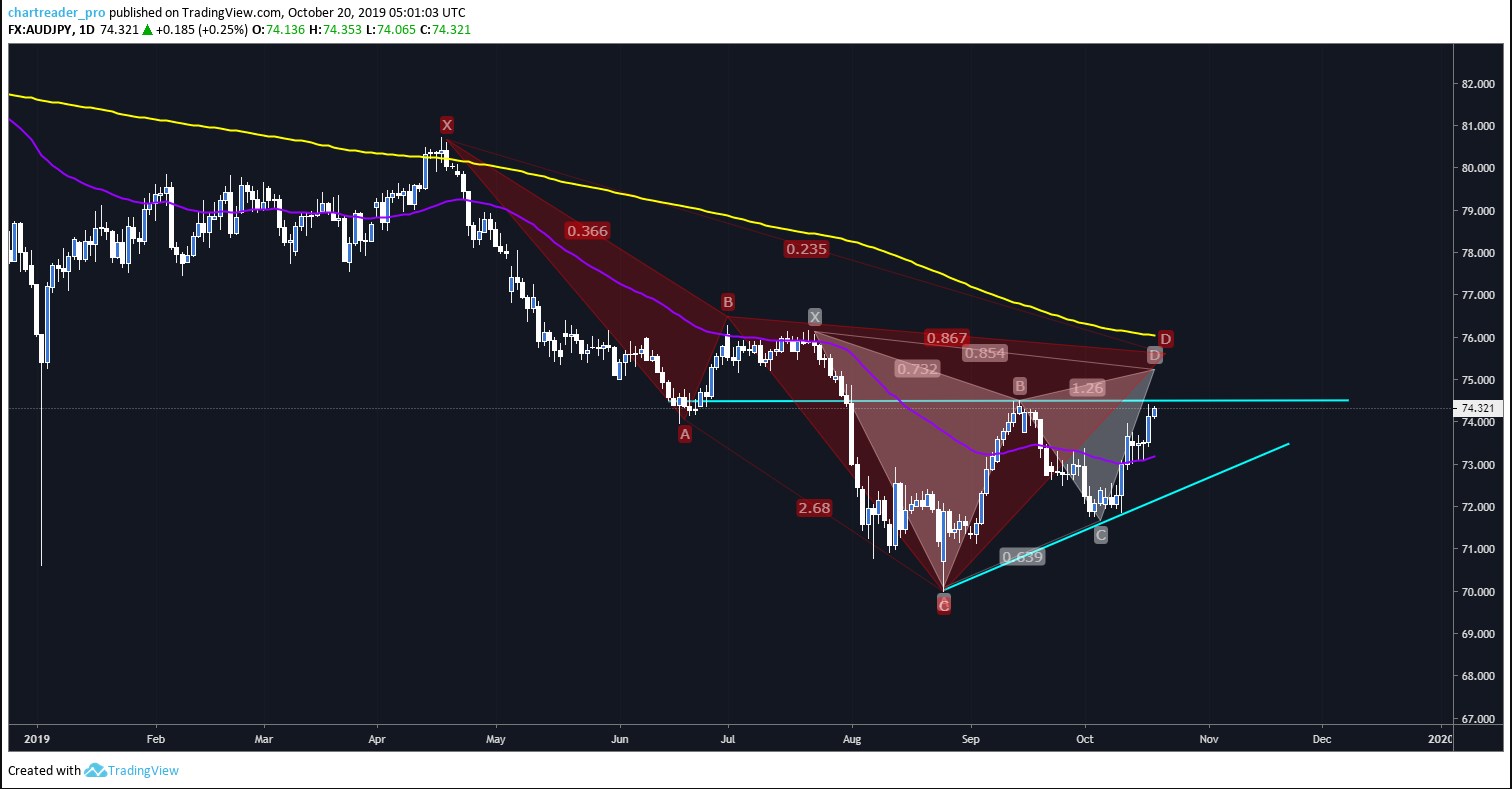
The big picture is similar to the NZDJPY pair. The price closed above EMA50 at 74.32.
EMA 50 support is 73.43 and the short-term bullish trend would remain unchanged as long as the price holds above the EMA 50 support.
Near term key resistance is 74.60 and 75.00. Upperside is capped by SMA200 at 76.10.
We see two major reversal patterns – Bearish Gartley at 75.20 and Bearish Swan at 75.56- in the Dail Chart.
As mentioned in the Live Interactive H4 Chart, Bearish Crab and Bearish Butterfly patterns indicate a minor reversal.
By the guidance of the harmonic patterns in the H4 chart, we can say that the price must break and close above 74.60 to continue its upward move.
Membro Desde Feb 08, 2018
40 postagens
Dec 01, 2019 at 07:09
Membro Desde Feb 08, 2018
40 postagens
EURGBP Forecast: UK General Elections Ahead
Fundamentals:
Weak Euro.
ECB Monetary Policy Decision on Dec 12th.
ECB is expected to keep its monetary policy unchanged. The wait-and-see policy and emphasis on financial supporting can be expected to continue.
UK General Elections and Brexit: General election poll projection claims Tories are set to win a 48-seat majority. The fact that the Conservative Party wins the elections with a majority, Boris Johnson is expected to activate the Brexit plan, which he had previously failed to approve in Parliament. And this will increase the possibility that Brexit will take place on January 30th.
Cheap Sterling and potential upside rooms in GBP Index confirm the bearish continuation in the EURGBP pair.
Technically:
Weekly Chart:
The pair ended the week at 0.85113, below EMA 50, SMA 100 & SMA200. EMA 50 cuts the SMA100 which is a strong bearish signal. The upside is capped by SMA 100 and EMA50 at 0.88000. And potential pullbacks towards the resistance zone can be used as a selling opportunity.
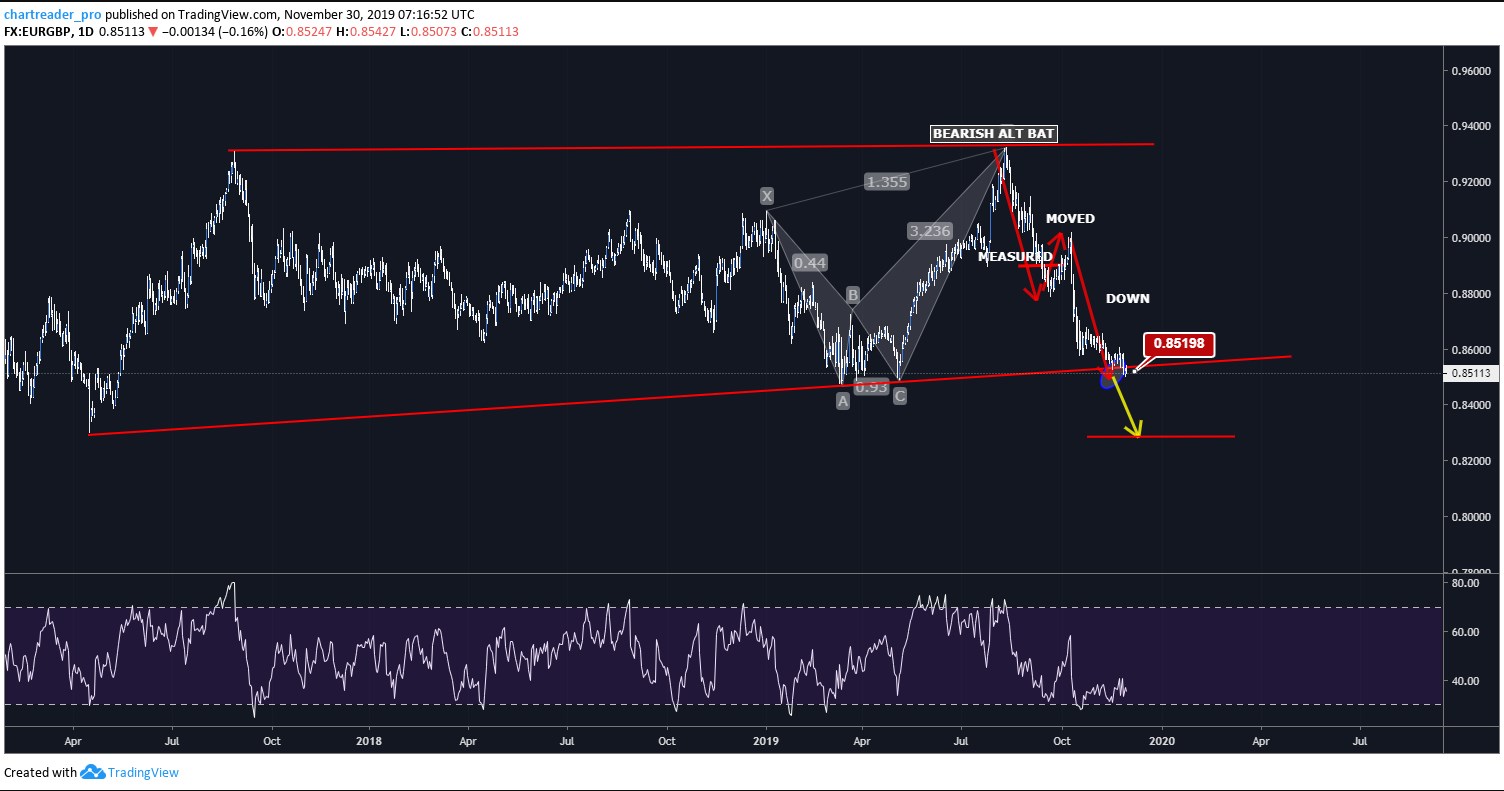
As seen on the Headline Daily Chart, we have achieved our first target of Measured Move Down at 0.85200. The next key target of the pair is 0.84550 as long as it holds below 0.85000.
Our medium-term price prediction is 0.82800. BoE’s Monetary Policy Decision will determine the next direction of the pair. However, we keep our Q4 2020 price prediction as 0.80600.
Smaller Charts:
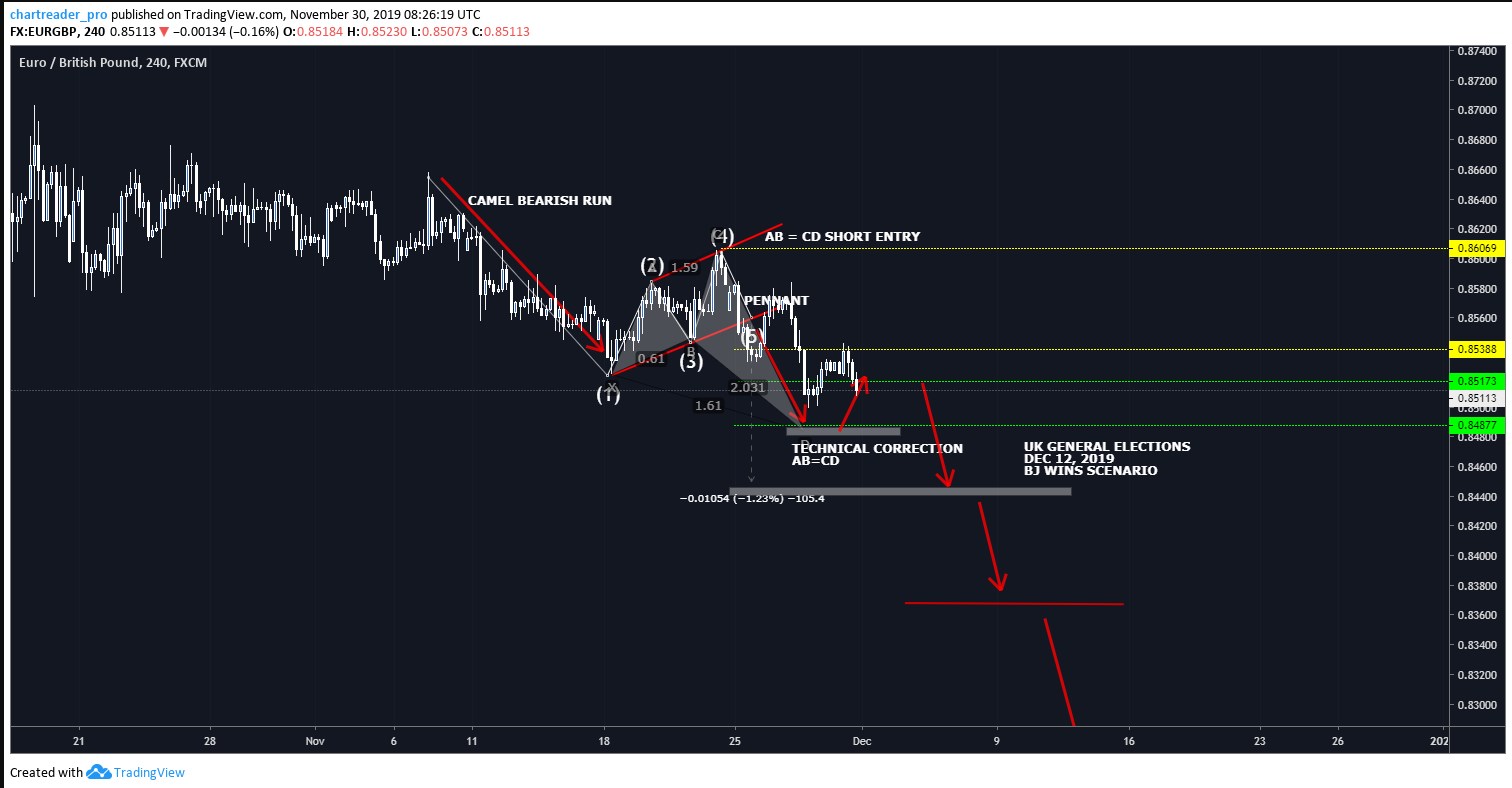
Our latest short term short trades – Bearish Swan, Pennant and Bearish Camel Run – reached their target levels.
The first target of the Camel Bearish Run was 0.85000. As we mentioned and updated on the live interactive charts, our next targets are 0.84820 ( Camel Run ) and 0.84570 ( Structural Target of the Pennant ).
Bullish ABCD pattern would be validated at 0.84800 and we may see a technical correction between 0.84800 and 0.84580 towards 0.85400 – 0.85600 region.
As usual, we plan to sell potential pullbacks targeting 0.84500, 0.83800 and 0.82800.
Intraday trade opportunities will be posted later.
Fundamentals:
Weak Euro.
ECB Monetary Policy Decision on Dec 12th.
ECB is expected to keep its monetary policy unchanged. The wait-and-see policy and emphasis on financial supporting can be expected to continue.
UK General Elections and Brexit: General election poll projection claims Tories are set to win a 48-seat majority. The fact that the Conservative Party wins the elections with a majority, Boris Johnson is expected to activate the Brexit plan, which he had previously failed to approve in Parliament. And this will increase the possibility that Brexit will take place on January 30th.
Cheap Sterling and potential upside rooms in GBP Index confirm the bearish continuation in the EURGBP pair.
Technically:
Weekly Chart:
The pair ended the week at 0.85113, below EMA 50, SMA 100 & SMA200. EMA 50 cuts the SMA100 which is a strong bearish signal. The upside is capped by SMA 100 and EMA50 at 0.88000. And potential pullbacks towards the resistance zone can be used as a selling opportunity.

As seen on the Headline Daily Chart, we have achieved our first target of Measured Move Down at 0.85200. The next key target of the pair is 0.84550 as long as it holds below 0.85000.
Our medium-term price prediction is 0.82800. BoE’s Monetary Policy Decision will determine the next direction of the pair. However, we keep our Q4 2020 price prediction as 0.80600.
Smaller Charts:

Our latest short term short trades – Bearish Swan, Pennant and Bearish Camel Run – reached their target levels.
The first target of the Camel Bearish Run was 0.85000. As we mentioned and updated on the live interactive charts, our next targets are 0.84820 ( Camel Run ) and 0.84570 ( Structural Target of the Pennant ).
Bullish ABCD pattern would be validated at 0.84800 and we may see a technical correction between 0.84800 and 0.84580 towards 0.85400 – 0.85600 region.
As usual, we plan to sell potential pullbacks targeting 0.84500, 0.83800 and 0.82800.
Intraday trade opportunities will be posted later.
Membro Desde Feb 08, 2018
40 postagens
Dec 01, 2019 at 07:11
Membro Desde Feb 08, 2018
40 postagens
XAUUSD Gold Report: US-China Trade War and Risk Appetite
Reminder: This article is a shortened version of our Gold report which is prepared for our investors. It can not be used as a buy/sell signal.
Highlights:
December 12 – ECB decision: The ECB is not expected to make changes to its monetary policy. The wait-and-see policy and emphasis on financial support can be expected to continue. It will not have a significant impact on gold.
December 12 – UK elections: Polls suggest that the Conservative Party will win the UK elections by increasing the number of votes and the number of seats in Parliament. The fact that the Conservative Party wins the elections with a majority, Boris Johnson is expected to activate the Brexit plan, which he had previously failed to approve in Parliament. And this will increase the possibility that Brexit will take place on January 30th. This would help to eliminate a significant global uncertainty. GOLD NEGATIVE
But; After the realization of Brexit, the trade negotiations between the UK and the EU will create new uncertainties. GOLD POSITIVE
December 15 – US-China tariffs: The phase-1 agreement between the US and China, which is expected to be signed in mid-November, has not signed yet and tensions are rising due to the Hong Kong protests between the US and China. As the economic slowdown in China becomes more evident, China continues to take significant steps to ensure the agreement, as in the case of copyright, and to ensure that the agreement is achieved.
Some analysts think the signing of the deal could be by the end of the year.
As it is known, the US decided to impose a 10% import tax on the $ 156 billion consumers product imported from China but postponed it to 15 December. Whether these taxes will come into force will be the main determinant of the negotiations. If the US begins to impose these taxes, this could lead to a break in negotiations and serious disruption of risk appetite on a global scale.- GOLD POSITIVE –
The continuation of the process may even raise the expectations of further interest rates cuts from the Fed. This may trigger a new upward trend in Gold. – GOLD POSITIVE-
Although the global economy signals return from the bottom and major central banks do not signal additional easing policies, this outlook may be reversed by the failure of trade negotiations between the US and China. Therefore; The main determinants of gold prices will continue to be US-China developments in the near future.
Technically:
On the weekly chart

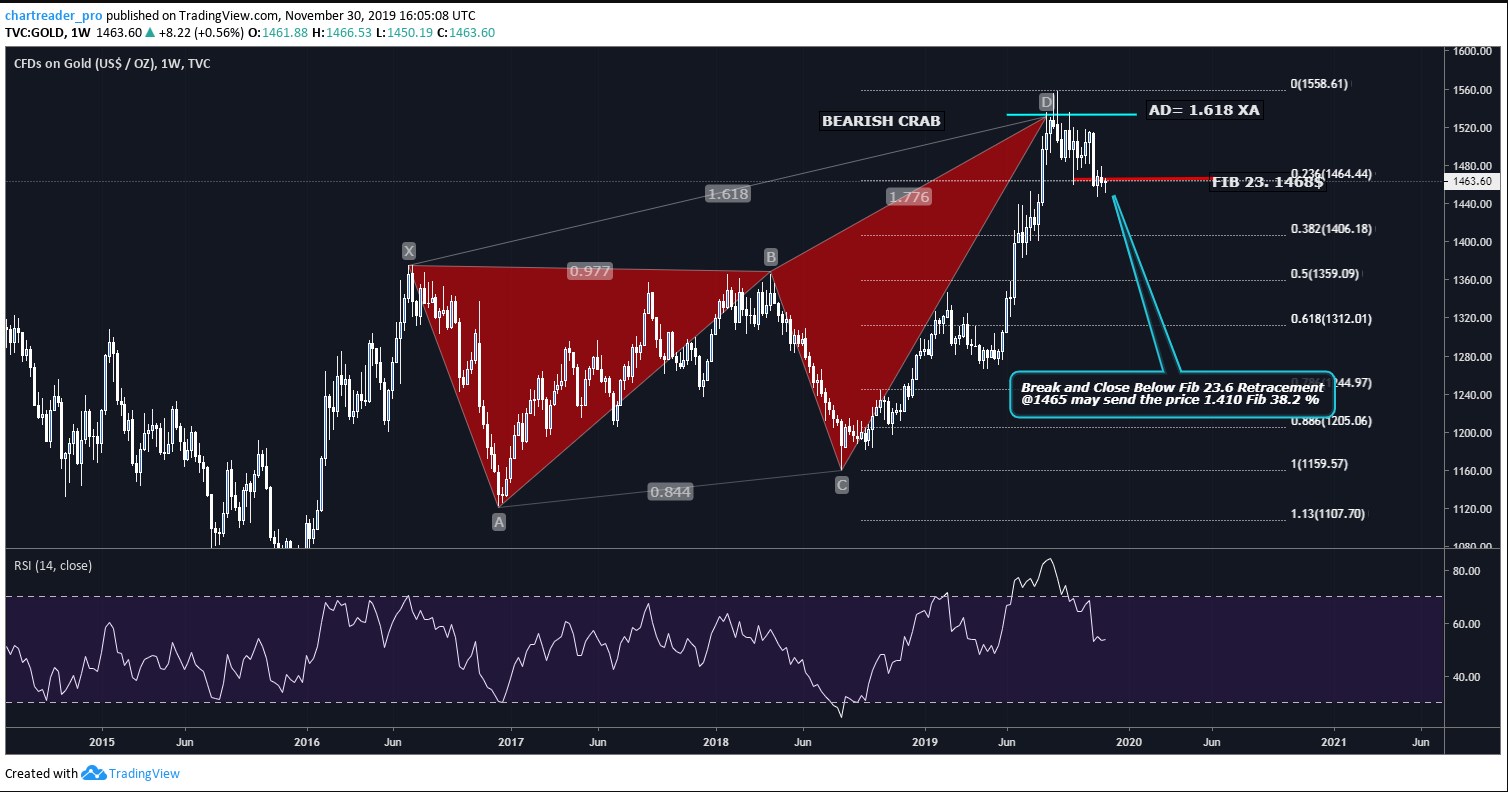
• As seen on the chart, Gold is making its technical correction.
• As long as it stays above USD 1,376 in the long term, we consider the pullbacks as an opportunity to buy. Daily closing above 1508 would be the confirmation of Bullish trend continuation to add long positions. Targets are 1586 1600 & 1652.
• If XAUUSD makes daily closing below 1.445 $, it is likely to test 1437 1421 and 1406.
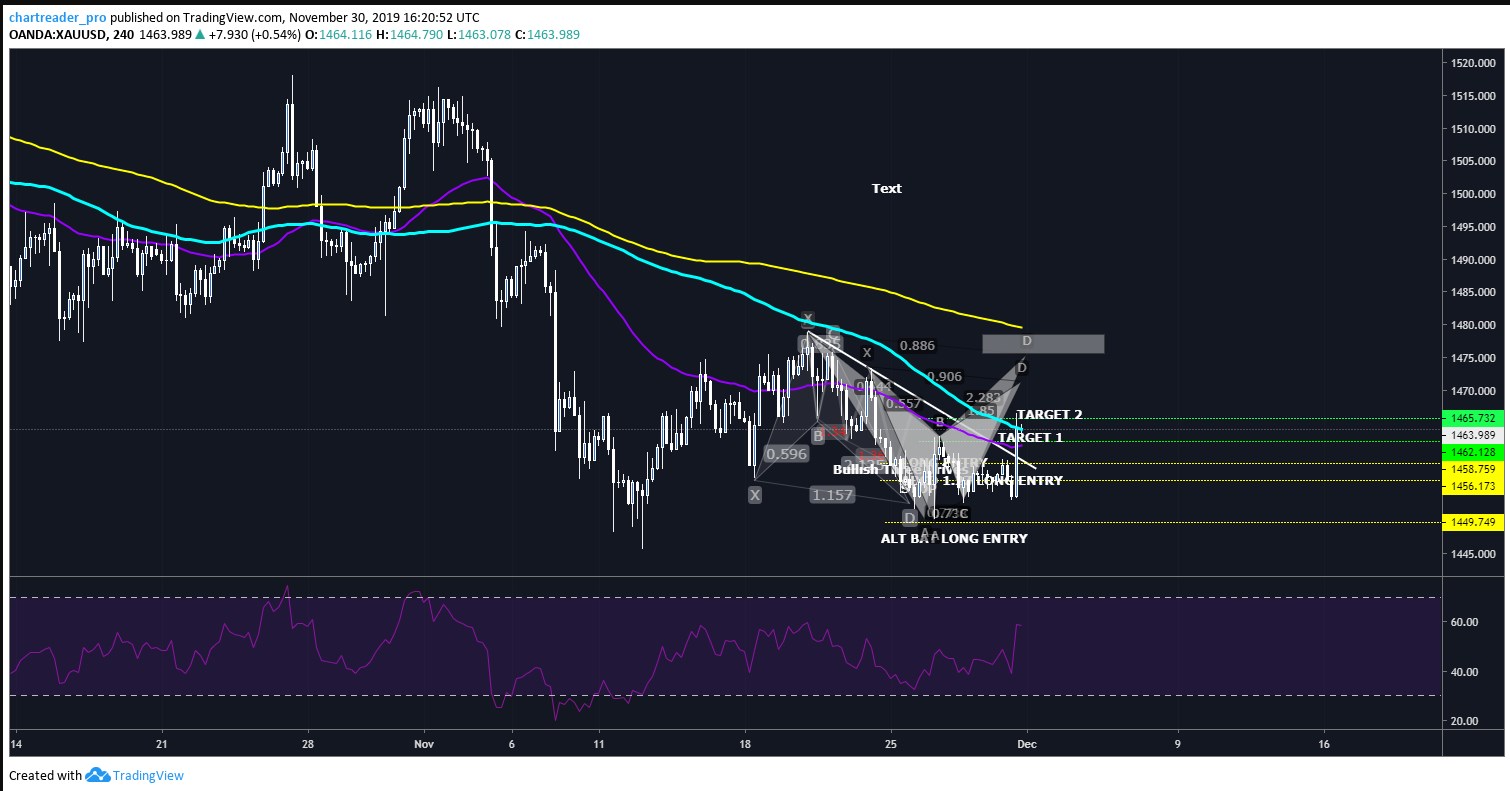
Smaller Charts:
Bullish Bat pattern and ABCD 1.27 Ext. are working. Price reached the TP2 Level. However, the upside is capped by SMA200 H4 and SMA100 D1 at 1.474-1480.
Two emerging harmonic patterns can be used as a selling opportunity.
Summary:
Longer-Term Gold Buy Levels: 1402 & 1508. Targets: 1586 1600 1652
Shorter Term Selling Opportunities: Pullbacks to 1475- 1486 and Daily CLosing Below 1437. Targets 1421 1406 1380
Membro Desde Feb 08, 2018
40 postagens
Jul 14, 2020 at 05:56
Membro Desde Feb 08, 2018
40 postagens
EURGBP Bearish White Swan And Short Opportunity
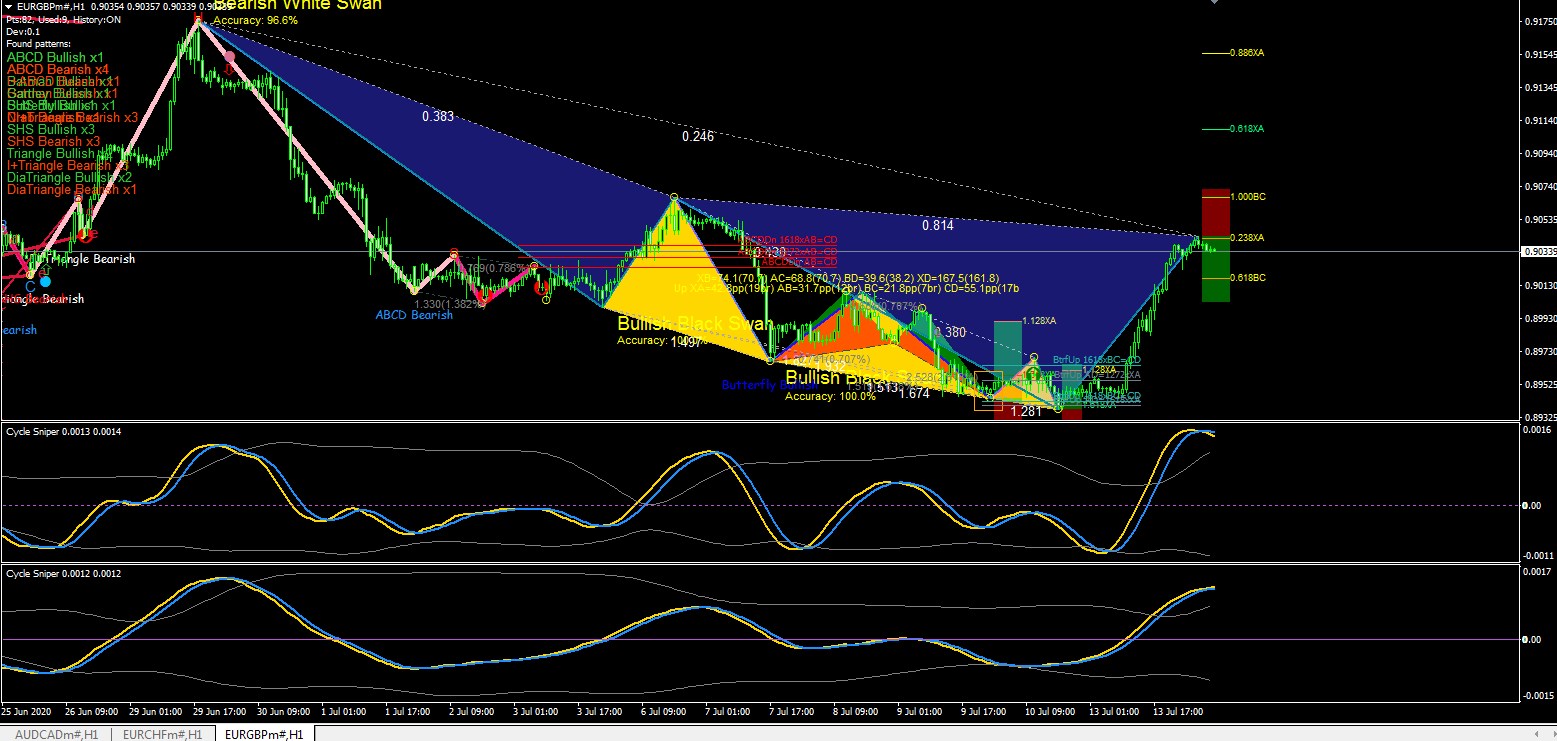
Chart Timeframe: H1
The pair hit the 0.238 of XA at 0.90400.
RSI is overbought.
Bearish White Swan Accuracy: 87%
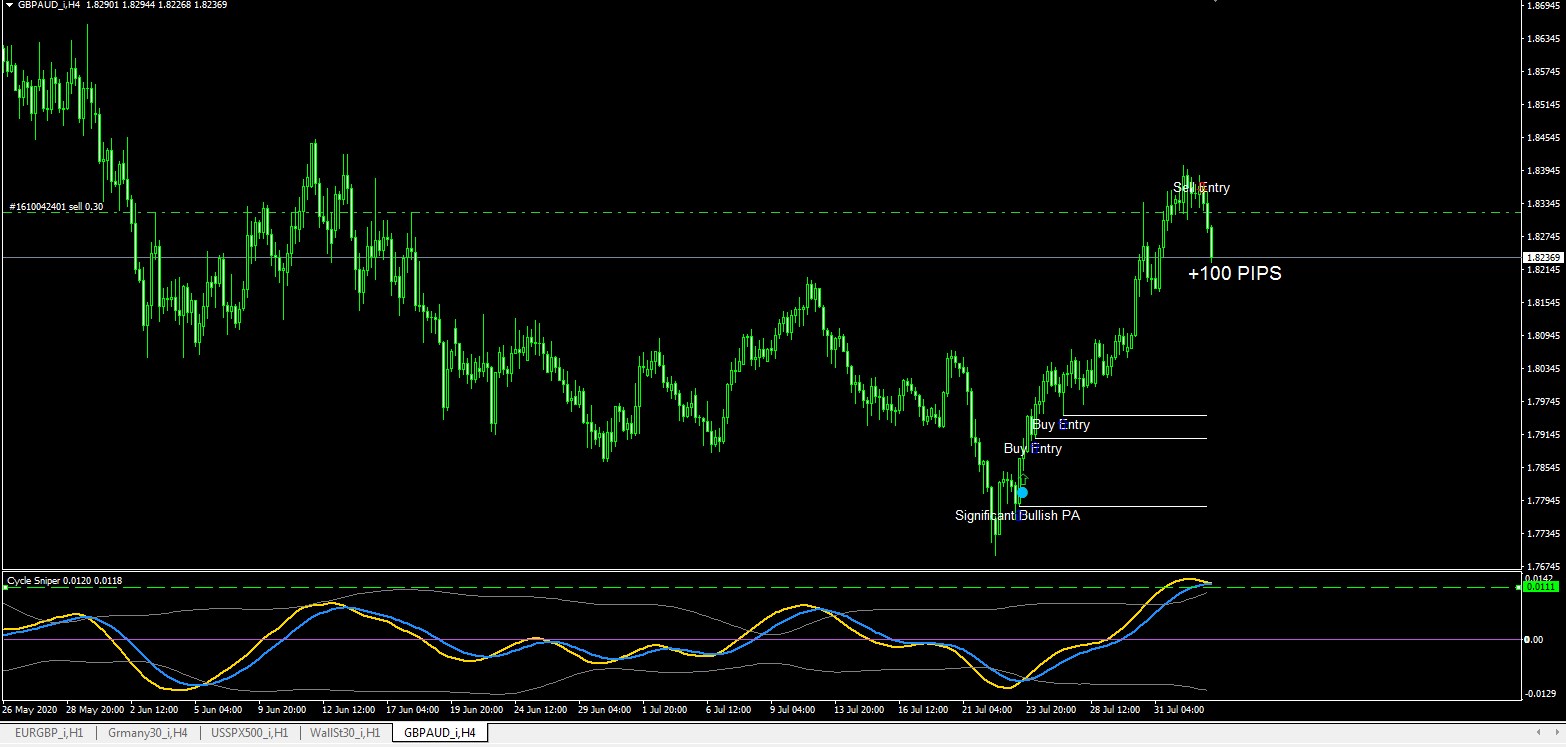
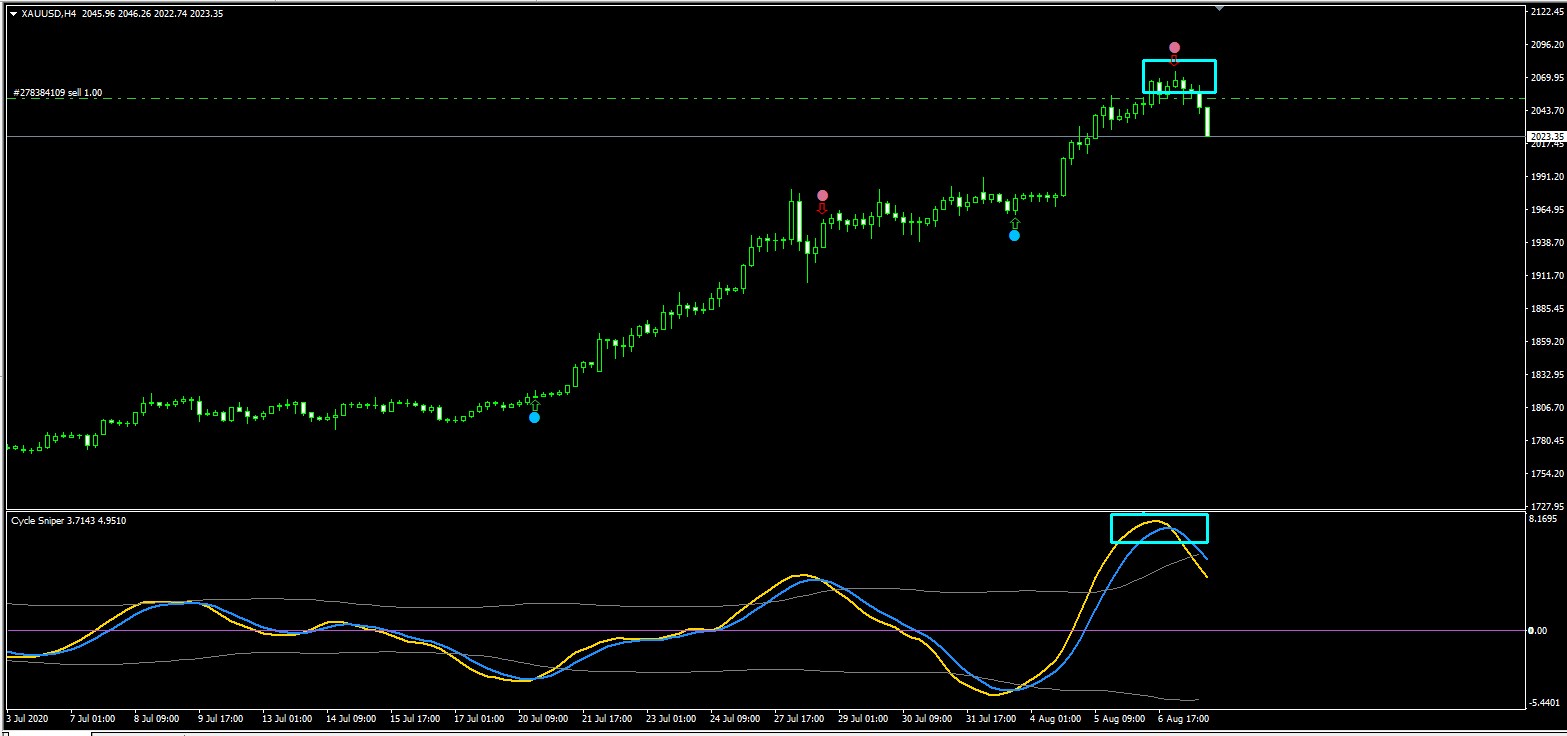
Both of the Cycle Snipers with different deviations are heading south.
We wait for a signal from one of the Cycle Sniper Indicators and enter the short trade.
Our targets: 0.90080 0.89800 0.89600
Good Luck
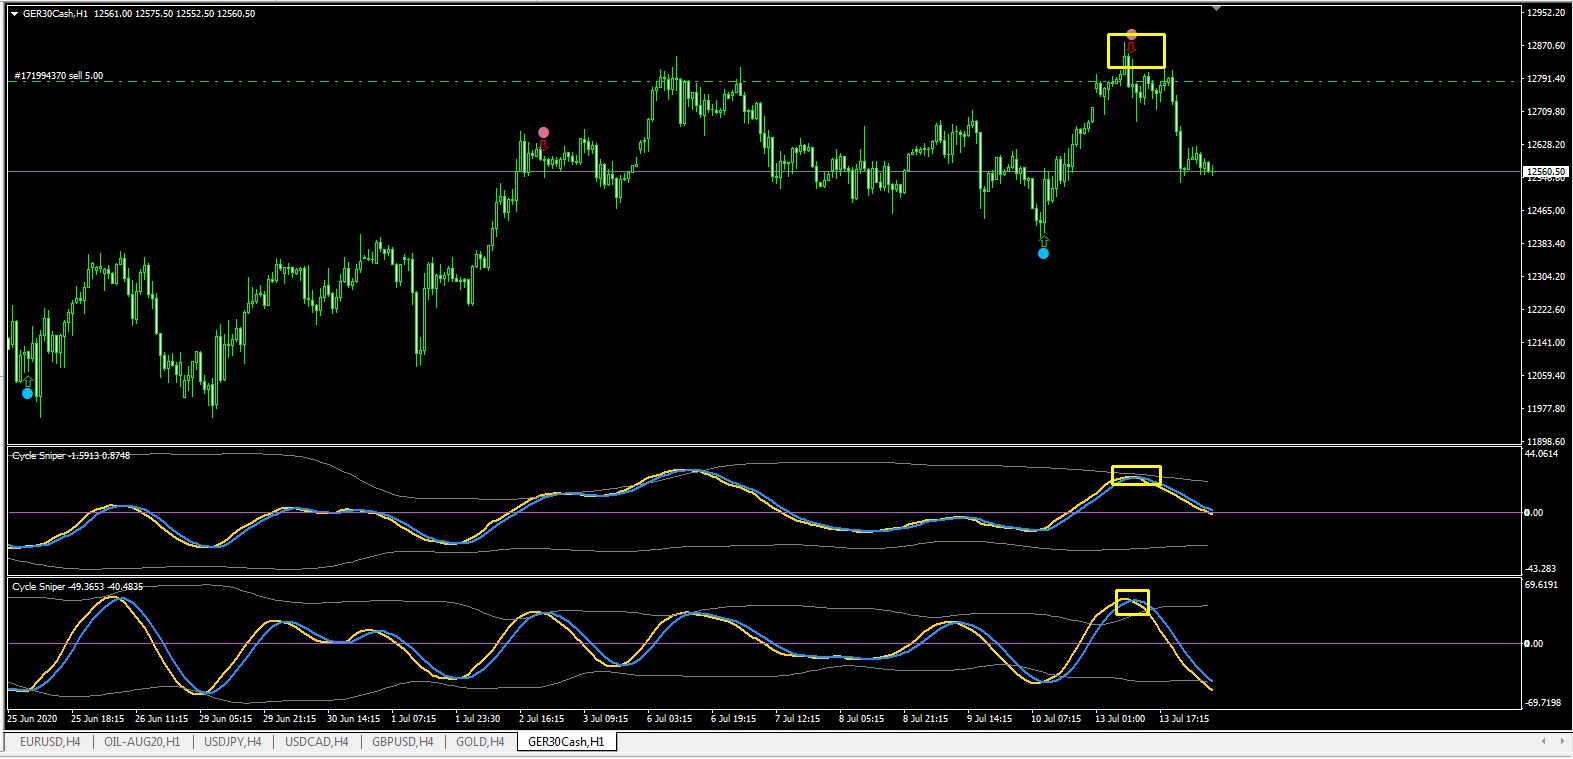
Check the below sample of two Cycle Sniper confirmation of DAX30 trade of yesterday:

Membro Desde Feb 08, 2018
40 postagens
Aug 04, 2020 at 13:21
Membro Desde Feb 08, 2018
40 postagens
Membro Desde Feb 08, 2018
40 postagens
Aug 07, 2020 at 15:11
Membro Desde Feb 08, 2018
40 postagens
Membro Desde Sep 28, 2020
9 postagens
Sep 30, 2020 at 07:32
Membro Desde Sep 28, 2020
9 postagens
GBP/USD sell.
USD/ZAR sell.
Gold buy.
USD/ZAR sell.
Gold buy.
Membro Desde Feb 08, 2018
40 postagens
Jan 23, 2021 at 12:46
Membro Desde Feb 08, 2018
40 postagens
Membro Desde Dec 15, 2020
13 postagens
Feb 17, 2021 at 04:54
Membro Desde Dec 15, 2020
13 postagens
This is the right platform for traders from all over to share their thoughts and trading knowledge here. Keep sharing.

*Não serão tolerados uso comercial ou spam. O não cumprimento desta regra poderá resultar na exclusão da conta.
Dica: Ao adicionar uma URL de imagem/youtube, você estará automaticamente incorporando-a à sua postagem!
Dica: Digite o símbolo @ para que o nome de um usuário que participe desta discussão seja completado automaticamente.


