Advertisement
Edit Your Comment
FxNews—Bitcoin Technical Analysis
Mitglied seit Sep 27, 2024
45 Posts
Oct 02, 2024 at 07:42
(bearbeitet Oct 02, 2024 at 06:41)
Mitglied seit Sep 27, 2024
45 Posts
Bitcoin Poised for Consolidation After Sell-Off
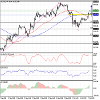
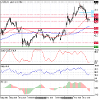
FxNews—Bitcoin's downtrend extended near the $59,500 supply zone after the sellers pushed the price below the 100-period simple moving average.
The robust selling pressure moved the RSI 14 and Stochastic oscillator into the oversold territory, showing 31 and 17 in the description, respectively.
Forecast
Bitcoin's primary trend should be bearish because the price is below the 50- and 100-period simple moving averages. However, we anticipate the BTCUSD price to step into a consolidation phase, ranging between $61,190 and $62,770 for the subsequent few trading sessions.
Knowledge Should Be Free – And So Is Your Path to Trading Success.
Mitglied seit Sep 27, 2024
45 Posts
Oct 07, 2024 at 06:08
Mitglied seit Sep 27, 2024
45 Posts
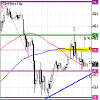
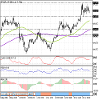
FxNews—Bitcoin broke the $63,200 pivot today, stabilizing above it. The Stochastic signals overbought conditions, meaning BTCUSD might consolidate before the uptrend resumes.
If the 50-SMA holds, the next bullish target could be $66,700.
If the 50-SMA holds, the next bullish target could be $66,700.
Knowledge Should Be Free – And So Is Your Path to Trading Success.
Mitglied seit Sep 27, 2024
45 Posts
Oct 09, 2024 at 11:27
Mitglied seit Sep 27, 2024
45 Posts
Bitcoin Bulls and Bears Battle at Fibonacci Marks
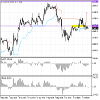
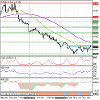
FxNews—Bitcoin remains bearish, staying below the 100-period simple moving average. The Awesome Oscillator and Stochastic indicators suggest increasing bearish momentum, with the latter entering oversold territory at 17, hinting at a potential price rebound. The Relative Strength Index, at 46, confirms the bearish outlook as it falls below the median. Additionally, a drop below the Supertrend line encourages a sell strategy.
Overall, indicators predict a further downtrend, possibly descending to lower support levels.
Bearish Scenario
Bearish momentum could extend to $59,800 if Bitcoin stabilizes below the 61.8% Fibonacci retracement of the bullish AB wave. The primary resistance is the 100-period SMA; breaching this could invalidate the bearish outlook.
Bullish Scenario
A lack of market momentum is evident, yet a surge above the 100-SMA, near the 50% Fibonacci retracement of the BC wave at about $63,200, could trigger a bullish reversal. Falling below the $61,700 support would nullify this scenario.
> Support: $61,700, $59,800, $57,765
> Resistance: $63,200, $64,280, $66,700
Knowledge Should Be Free – And So Is Your Path to Trading Success.
Mitglied seit Sep 27, 2024
45 Posts
Oct 14, 2024 at 08:50
Mitglied seit Sep 27, 2024
45 Posts
Bitcoin Hits $64,280, Now Overbought: Caution Advised
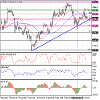
FxNews—Bitcoin's rebound from $59,800 resulted in the bulls hitting $64,280. The robust buying pressure drove Stochastic into overbought territory, signaling that BTCUSD is overbought in the short term. Going long in an overbought market is not advisable; therefore, traders and investors should consider waiting patiently for the market to consolidate and fill previous gaps.
That said, the price can potentially consolidate near $63,200 before the uptrend resumes. This level provides a solid entry point into the bull market.
Knowledge Should Be Free – And So Is Your Path to Trading Success.
Mitglied seit Sep 27, 2024
45 Posts
Oct 15, 2024 at 07:59
Mitglied seit Sep 27, 2024
45 Posts
Bitcoin Peaks at $66,700: Bearish Signal Ahead
FxNews—Bitcoin’s uptrend resulted in the price peaking at the $66,700 ceiling. The BTC/USD 4-hour chart formed a bearish long-wick candlestick pattern, while the RSI and Stochastic indicators signal overbought conditions.
The Bitcoin price can test the $64,280 resistance before the uptrend resumes.
FxNews—Bitcoin’s uptrend resulted in the price peaking at the $66,700 ceiling. The BTC/USD 4-hour chart formed a bearish long-wick candlestick pattern, while the RSI and Stochastic indicators signal overbought conditions.
The Bitcoin price can test the $64,280 resistance before the uptrend resumes.
Knowledge Should Be Free – And So Is Your Path to Trading Success.
Mitglied seit Sep 27, 2024
45 Posts
Oct 21, 2024 at 10:05
Mitglied seit Sep 27, 2024
45 Posts
BTC Tests Bollinger Median Amid MACD Divergence
FxNews—Bitcoin's price pulled back from $69,500, testing the median line of the Bollinger Bands. The MACD indicator signals divergence, meaning the current consolidation phase could extend to the lower support levels, starting with filling the FVG (Fair Value Gap) at $67,500 and followed by $66,680.
These two support levels are backed by the Ichimoku Cloud, making them decent zones for betting on the bullish trend. Retail traders and investors should monitor the support mentioned above levels for bullish signals, such as hammer or bullish engulfing candlestick patterns.
Please note that it is not advisable to join a bull market while it is saturated. It carries a greater risk than buying a trading security at a dip.
Knowledge Should Be Free – And So Is Your Path to Trading Success.
Mitglied seit Sep 27, 2024
45 Posts
Oct 21, 2024 at 16:54
Mitglied seit Sep 27, 2024
45 Posts
Ethereum Tests Key Fibonacci Level at $2,665
FxNews—The 4-hour Ethereum chart formed a Bat harmonic pattern, backed by MACD's divergence signal, which resulted in the price dipping from $2,770. As of this writing, ETH/USD is testing the 23.6% Fibonacci retracement level at $2,665.
From a technical perspective, the consolidation phase will likely extend to the 38.2% Fibonacci level at $2,600 if ETH/USD stabilizes below the 23.6% level. Notably, the Ichimoku Cloud supports the 38.2% Fibonacci level, a significant supply zone for entering the bull market.
Therefore, traders should closely monitor the $2,600 mark for bullish candlestick patterns.
Knowledge Should Be Free – And So Is Your Path to Trading Success.
Mitglied seit Sep 27, 2024
45 Posts
Oct 22, 2024 at 09:18
Mitglied seit Sep 27, 2024
45 Posts
Oversold Litecoin Prepares for Bearish Wave or Rebound
FxNews—Litecoin stabilized the price below the critical $71 support, backed by the 5-period simple moving averages. However, the robust selling pressure from $76.0 drove the Stochastic Oscillator into oversold territory, meaning the U.S. Dollar is overpriced.
Hence, the Litecoin price is expected to consolidate around the 50-period SMA before the downtrend resumes. The consolidation ranges from the $69.7 immediate support to the %38.2 Fibonacci retracement level at $71.9 critical resistance.
Please note that a new bearish wave will likely be started if bears break today's low, the $69.7 support below. In this scenario, the next bearish target could be the October 7 high, the $67.5 support.
P.S. The bearish outlook should be invalidated if LTC/USD exceeds the %38.2 Fibonacci retracement level at $71.9.
Knowledge Should Be Free – And So Is Your Path to Trading Success.
Mitglied seit Aug 18, 2019
74 Posts
Oct 22, 2024 at 11:19
Mitglied seit Aug 18, 2019
74 Posts
I've been keeping an eye on Litecoin too, as I trade LTC myself. It’s definitely looking like a key moment with the consolidation around the 50-period SMA. If it breaks below that $69.7 support, it could trigger a bigger drop, but I’m also watching closely to see if it can rebound past the $71.9 resistance. Would be interesting to see how it plays out!
Adapt, analyze, and achieve — one trade at a time.
Mitglied seit Sep 27, 2024
45 Posts
Oct 22, 2024 at 13:26
Mitglied seit Sep 27, 2024
45 Posts
Ripple's Fall Below $0.54 Signals More Drops
FxNews—The Ripple (XRP) bulls failed to surpass the $0.56 resistance. Consequently, the price dipped below the $0.54 immediate support. As a result, the downtrend resumed, with the critical resistance remaining valid at the October 17 high.
The technical indicators suggest the downtrend should resume. In this scenario, the XRP/USD price will likely revisit the October 3 low at $0.507. The bearish outlook should be invalidated if XRP exceeds $0.5600.
Knowledge Should Be Free – And So Is Your Path to Trading Success.
Mitglied seit Sep 27, 2024
45 Posts
Oct 22, 2024 at 13:28
Mitglied seit Sep 27, 2024
45 Posts
y8g9NkylxG posted:
I've been keeping an eye on Litecoin too, as I trade LTC myself. It’s definitely looking like a key moment with the consolidation around the 50-period SMA. If it breaks below that $69.7 support, it could trigger a bigger drop, but I’m also watching closely to see if it can rebound past the $71.9 resistance. Would be interesting to see how it plays out!
Hello,
Your analysis is correct. At the time of posting, LTC/USD is on the verge of dropping below the $69.7 support level.
Knowledge Should Be Free – And So Is Your Path to Trading Success.
Mitglied seit Sep 27, 2024
45 Posts
Oct 23, 2024 at 08:47
Mitglied seit Sep 27, 2024
45 Posts
Will Solana Bounce Back Above $171.7? Key Levels to Watch
FxNews—Solana consolidates below the $171.7 high as expected because the Stochastic and RSI 14 signaled overbought at the time. As of this writing, SOL/USD trades at approximately $165.6, testing the median line of the Bollinger Bands.
The primary trend should be considered bullish because the price is above the 50- and 100-period simple moving averages. However, the Awesome Oscillator histogram is red, signaling that the downtick momentum from $171.7 could extend to the lower support levels.
From a technical perspective, the trend outlook remains bullish as long as Solana trades above $161.5. However, for the uptrend to resume, the Bulls must close and stabilize the price above $171.7.
Conversely, a dip below the $161.5 should invalidate the bullish outlook. In this scenario, a new bearish wave will likely form, and the target could be the 100-period SMA at $152.0.
Knowledge Should Be Free – And So Is Your Path to Trading Success.
Mitglied seit Aug 18, 2019
74 Posts
Oct 23, 2024 at 13:43
Mitglied seit Aug 18, 2019
74 Posts
The dip below $0.54 for XRP does point to continued downside pressure, especially with the technicals showing more bearish momentum. If it revisits the $0.507 low from earlier this month, it could signal a deeper correction. However, with XRP's tendency for sudden rebounds, a breakout above $0.56 could still shift the sentiment. In the meantime, watching how it reacts around key support levels like $0.507 will be crucial to understanding the next move.
Adapt, analyze, and achieve — one trade at a time.
Mitglied seit Sep 27, 2024
45 Posts
Oct 24, 2024 at 12:42
Mitglied seit Sep 27, 2024
45 Posts
Ethereum Eyes $2,590: Can Bulls Hold $2,505 Support?
FxNews—Ethereum price rebounded from $2,450, the September 14 high. However, the uptick momentum eased when the price hit the 100-period SMA as resistance.
The technical indicators show signs of a bullish trend, with both the Stochastic and RSI 14 rising from the oversold territory. Meanwhile, the Awesome Oscillator histogram has turned green, which is interpreted as a sign that the bull market is strengthening.
Immediate support is at $2,505. The current uptick momentum has the potential to fill the Fair Value Gap at $2,590, provided the bulls maintain their position above the immediate support.
Conversely, the bullish outlook will be invalidated if ETH/USD dips below the $2,505 mark. In this scenario, Ethereum will likely revisit $2,459, and if the selling pressure increases, the downtrend could extend to the October 10 low at $2,330.
Knowledge Should Be Free – And So Is Your Path to Trading Success.
Mitglied seit Sep 27, 2024
45 Posts
Oct 24, 2024 at 15:59
Mitglied seit Sep 27, 2024
45 Posts
Litecoin Eyes $71.5 Amid Bullish Momentum
FxNews—Litecoin bounced off the $67.5 resistance, backed by the 100-period SMA. As of this writing, LTC trades at approximately $70.4, testing the 38.2% Fibonacci retracement level.
The primary trend is bullish because LTC/USD is above the 100-period simple moving average. Additionally, the Awesome Oscillator histogram is green and rising toward the signal line.
From a technical perspective, the uptrend will likely resume with the next bullish target at $71.5, a resistance area backed by the 50% Fibonacci and the Fair Value Gap area.
The immediate support rests at $69.7. The bullish outlook should be invalidated if LTC/USD dips below this support.
Knowledge Should Be Free – And So Is Your Path to Trading Success.
Mitglied seit Aug 18, 2019
74 Posts
Oct 25, 2024 at 13:40
Mitglied seit Aug 18, 2019
74 Posts
I'm trading Ethereum with a close watch on the $2,505 support. If it holds, I’m targeting $2,590 to capture the potential bullish momentum indicated by the Stochastic and RSI. My stop is just below $2,505, as a break there could push ETH back to around $2,459 or further to $2,330 if the bears strengthen. For risk management, I'm looking to tighten my stop if Ethereum gets close to the target, given the recent resistance around the 100-period SMA.
Adapt, analyze, and achieve — one trade at a time.
Mitglied seit Sep 27, 2024
45 Posts
Oct 26, 2024 at 15:16
Mitglied seit Sep 27, 2024
45 Posts
Bitcoin Eyes $68,750: Bullish Momentum Grows
FxNews—Bitcoin is trading around $66,800, holding above the 100-period simple moving average (SMA) and the critical support level of $65,200.
Technical indicators suggest a mildly bearish trend, with both the Stochastic and RSI 14 declining. However, the Awesome Oscillator’s histogram has turned green, indicating bullish momentum is gaining strength. In addition to the signal from the Awesome Oscillator, the 4-hour chart shows a long-wick bullish candlestick pattern.
Technically, if Bitcoin stays above the 100-period SMA, the bullish move may target $68,750, followed by the $69,580 resistance level. However, this bullish outlook becomes invalid if the price drops below $65,200.
Knowledge Should Be Free – And So Is Your Path to Trading Success.
Mitglied seit Sep 27, 2024
45 Posts
Oct 29, 2024 at 13:54
Mitglied seit Sep 27, 2024
45 Posts
Cardano Eyes $0.347 Break as Bulls Take Charge
FxNews—Cardano is testing the 100-SMA at $0.347 amid the Stochastic signaling overbought. On the other hand, the Awesome Oscillator indicates that the bull market should prevail, with a green histogram above the signal line.
From a technical perspective, the bullish wave should resume after a minor consolidation below the $0.347 immediate resistance. In this scenario, the next bullish target could be the $0.358 resistance area (FVG) if bulls stabilize the price above the immediate resistance.
Please note that the bullish scenario should be invalidated if ADA/USD falls below the $0.338 immediate support. If this scenario unfolds, a new bearish wave will likely be triggered, targeting $0.33 followed by $0.323.
Knowledge Should Be Free – And So Is Your Path to Trading Success.
Mitglied seit Sep 27, 2024
45 Posts
Oct 30, 2024 at 12:12
Mitglied seit Sep 27, 2024
45 Posts
EURUSD Faces Strong Resistance at 1.087
FxNews—The EUR/USD currency pair tested the 100-period simple moving average at approximately 1.087 in today's trading session. This level was backed by Fair Value Gap, making it a robust barrier that can halt the bullish momentum.
Consequently, the price bounced from the 100-period SMA. From a technical standpoint, immediate resistance is at $1.087. If bears maintain a position below that mark, the downtrend will likely revisit $1.076.
Conversely, a cross above the 100-SMA invalidates the bearish outlook.
Knowledge Should Be Free – And So Is Your Path to Trading Success.
Mitglied seit Sep 27, 2024
45 Posts
Nov 04, 2024 at 18:56
Mitglied seit Sep 27, 2024
45 Posts
Bitcoin Drops Below Key Level: Is $66K the Next Target?
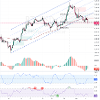
FxNews—Bitcoin dipped below the 38.2% Fibonacci retracement level after the price tested the bearish Fair Value Gap in conjunction with the broken trendline. Furthermore, the Awesome Oscillator histogram turned red, hinting at the downtrend strengthening.
From a technical perspective, the next bearish target should be the 50% Fibonacci level at $66,000. Please note that the bearish strategy should be invalidated if BTC/USD exceeds $70,000.
Knowledge Should Be Free – And So Is Your Path to Trading Success.

*Kommerzielle Nutzung und Spam werden nicht toleriert und können zur Kündigung des Kontos führen.
Tipp: Wenn Sie ein Bild/eine Youtube-Url posten, wird diese automatisch in Ihren Beitrag eingebettet!
Tipp: Tippen Sie das @-Zeichen ein, um einen an dieser Diskussion teilnehmenden Benutzernamen automatisch zu vervollständigen.


