KeltnerPRO - Jared (bei keltnerpro)
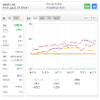
| Gewinn : | +5645.75% |
| Drawdown | 58.74% |
| Pips: | 4744.8 |
| Trades | 1003 |
| Gewonnen: |
|
| Verloren: |
|
| Typ: | Real |
| Hebel: | 1:100 |
| Trading: | Unbekannt |
Edit Your Comment
KeltnerPRO - Jared Diskussion
Mar 28, 2016 at 07:33
Mitglied seit May 03, 2012
226 Posts
first think what you write here... the ea is no scam, i run since 2 years and i have 95% same trades ... you cannto write its scam, when you have different results in your backtest.... set live to a ecn broker ( tickmill, icmarkets pepperstone and so on and you will see that it trades correct.... when you are afraid to go live, then go live with small deposit from 100 $ and 0.01 lot
Mitglied seit Jan 05, 2016
1097 Posts
Mar 28, 2016 at 10:02
Mitglied seit Jan 05, 2016
1097 Posts
If it looks too good to be true, it's probably a scam! Let the buyer beware.
Mitglied seit Jan 05, 2016
1097 Posts
Mar 28, 2016 at 10:07
Mitglied seit Jan 05, 2016
1097 Posts
If it looks too good to be true, it's probably a scam! Let the buyer beware.
Mitglied seit Jan 05, 2016
1097 Posts
Mar 28, 2016 at 10:08
Mitglied seit Jan 05, 2016
1097 Posts
The discussion on those two links above raise some serious concerns.
Would you care to elaborate as to the current situation?
Would you care to elaborate as to the current situation?
If it looks too good to be true, it's probably a scam! Let the buyer beware.
Mar 28, 2016 at 11:27
Mitglied seit May 03, 2012
226 Posts
when people learn to accept losses with a good ea , they will win in the end with patience. but when you change the ea or stopp running after few losses and take a other one and so on... you will always loose... i did the same in my beginning times with eas.... after few losses i stopped and bought a other one, and so on...
Mitglied seit Nov 16, 2012
18 Posts
Apr 19, 2016 at 13:39
Mitglied seit Aug 25, 2012
32 Posts
ericnyamu posted:
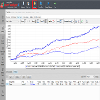
wow. that equity 'growth' curve is surely scary.it might be generally going up but those dips take the heart to stomach, lol
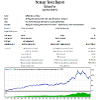
This is due to an optical illusion produced by the graphs, and by modifications to the compounding factor / risk setting since inception. The greater the balance the greater the appearance of massive balance growth fluctuations to the far end of the graph. To adjust for these visual biases you need to download the CSV of the trade history, and reproduce a graph of the performance in raw PIP growth, not balance growth. You'll see that the growth curve is actually fairly consistent and stable over the whole length of the period (including backtests dating all the way to 2005).
- TimeWarp to 2030 AD -
Apr 19, 2016 at 13:40
Mitglied seit Aug 25, 2012
32 Posts
Hennessy posted:
This is a scam!!!
How it is posible if i made backtest, but result is diferent from result what are here!!!!
I wouldn't just suddenly jump to hasty conclusions without first looking at the problem from multiple angles.
Did you ensure that backtests are using the highest quality historical data i.e. 99% modelling quality? I have made various mistakes in setting up backtests in the past and once I have resolved them then the discrepancies in live results and backtest results are mitigated.
Did you make sure to separate out results for respective currency pairs i.e. EURUSD, GBPUSD, USDCHF for valid comparisons? Did you adjust for risk levels i.e. lot sizing by re-adjusting? Are you ensuring that you are looking at actual pip growth (the true marker of performance) rather than the balance growth (which is skewed by lot sizing parameters)? You will need to use Excel spreadsheet to make a rigorous analysis. You can also use the 'custom analysis' function on myfxbook. There is also StrategyQuant's 'Quant Analyzer' tool which I also use for further analysis.
My own tests (demo, forward-live, and backtests) gives strong probability that this EA is legit. Even other people using this EA and have live results on myfxbook demonstrates that it is replicating trades and results with fair consistency.
- TimeWarp to 2030 AD -
Mitglied seit May 20, 2011
694 Posts
Apr 21, 2016 at 23:54
Mitglied seit May 20, 2011
694 Posts
ericnyamu posted:yes and it is just relative to risk setting. you can use fixed lot or lower risk % setting for smoother equity growth. I haven't used this EA since start of the year but looking forward to putting it on again! Its a really great tool.
wow. that equity 'growth' curve is surely scary.it might be generally going up but those dips take the heart to stomach, lol
May 15, 2016 at 03:32
Mitglied seit Sep 01, 2013
41 Posts
It is not a scam. It depends on heavy volatility to make a trade. The market conditions are not favoring it right now. It is not doing as well as it used to. I used it in 2014 through part of 2015. I wish that I knew how to make it better.
May 17, 2016 at 06:23
Mitglied seit Aug 25, 2012
32 Posts
ckdorgay posted:
It is not a scam. It depends on heavy volatility to make a trade. The market conditions are not favoring it right now. It is not doing as well as it used to. I used it in 2014 through part of 2015. I wish that I knew how to make it better.
That could be probable but from the perspective of a present bias; there have been periods in the past where this system also shows poor performance for a given year similar to now, but followed by massive gains in subsequent years that followed. Takeaway: it might still have a good chance of working in the future provided the markets exhibit volatility favorable to the system again.
Another concern could be: that volatility breakouts can still occur but fail to reach profit target levels due to such market anomalies being more efficiently arbitraged out by other competition over time, and that would lead to steady losses (which could be interpreted as false breakouts but are in reality valid breakouts that are just being better exploited by everyone else). If that is the case, lowering or optimizing the threshold of the target exits might solve the problem but at the expense of less potential profit per trade (and potentially affecting the overall profitability / behaviour of the system in unforeseen ways).
- TimeWarp to 2030 AD -
May 17, 2016 at 06:32
Mitglied seit Aug 25, 2012
32 Posts
To illustrate, backtest performance indicates stagnation from periods such as:
- mid-2005 to mid 2006
- late 2006 to late 2008
- start of 2010 to late 2010
- mid 2012 to start of 2013
Ideally we'd need some kind of empirical framework to determine if a system is truly broken i.e. be able to distinguish whether fluctuations in system performance is due to correlated fluctuations in market conditions (transition from optimal to suboptimal volatility), or whether it is fluctuating undesirably regardless of whether market conditions are optimal or not (not profiting even under optimal volatility). Of course other criteria should be included for this. One interesting consideration is that since this system seems to leave no room for optimizing lots of parameters (not even the exit levels), curve-fitting bias would appear to be less and so there's less of a chance that this system is trading randomly (hence not enough indication to suggest that this system "no longer works"). But one troubling aspect is how it has a bias towards currency pairs with USD in it, where the kind of market anomaly the system is trying to look for might not be present in other currency pairs outside of the USD and so its survival may depend a lot on that particular currency.
- TimeWarp to 2030 AD -
May 19, 2016 at 11:55
Mitglied seit Jul 31, 2012
210 Posts
vocasla posted:
To illustrate, backtest performance indicates stagnation from periods such as:
- mid-2005 to mid 2006
- late 2006 to late 2008
- start of 2010 to late 2010
- mid 2012 to start of 2013
Ideally we'd need some kind of empirical framework to determine if a system is truly broken i.e. be able to distinguish whether fluctuations in system performance is due to correlated fluctuations in market conditions (transition from optimal to suboptimal volatility), or whether it is fluctuating undesirably regardless of whether market conditions are optimal or not (not profiting even under optimal volatility). Of course other criteria should be included for this. One interesting consideration is that since this system seems to leave no room for optimizing lots of parameters (not even the exit levels), curve-fitting bias would appear to be less and so there's less of a chance that this system is trading randomly (hence not enough indication to suggest that this system "no longer works"). But one troubling aspect is how it has a bias towards currency pairs with USD in it, where the kind of market anomaly the system is trying to look for might not be present in other currency pairs outside of the USD and so its survival may depend a lot on that particular currency.
There's a clear PA pattern when this EA makes money and when it doesnt....Change your time frame to Daily...and you will see..
vladrac@
May 20, 2016 at 07:47
Mitglied seit Aug 25, 2012
32 Posts

*Kommerzielle Nutzung und Spam werden nicht toleriert und können zur Kündigung des Kontos führen.
Tipp: Wenn Sie ein Bild/eine Youtube-Url posten, wird diese automatisch in Ihren Beitrag eingebettet!
Tipp: Tippen Sie das @-Zeichen ein, um einen an dieser Diskussion teilnehmenden Benutzernamen automatisch zu vervollständigen.


