- Utama
- Komuniti
- Pedagang Berpengalaman
- Supply&Demand Price Action By The5ers Prop trading Fund
Advertisement
Edit Your Comment
Supply&Demand Price Action By The5ers Prop trading Fund
Ahli sejak Jul 24, 2018
108 hantaran
Jun 06, 2019 at 12:52
Ahli sejak Jul 24, 2018
108 hantaran
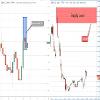
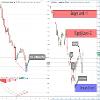
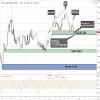
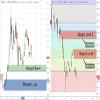
On the 1D chart, the previous day’s candle has ended as an outside bar candlestick pattern, which is a reversal pattern.
We can see how this candle was engulfed the day before. The height of the outside bar was higher than the height of the previous day. and the low of the outside
Bar was lower than the previous day’s low. Since it’s a bearish outside bar, we should look for a sell position.
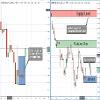
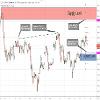
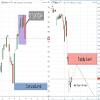
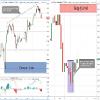
In the 15M chart, there is a great supply above which is also the top of the outside bar candlestick. If the price retraces toward the supply – it will be a great opportunity for sell position.
The first target for this position will be the support below at 1.1130 zones, and the final target will be at 1.0750 zones.
We fund the top 5% forex traders
Ahli sejak Jul 24, 2018
108 hantaran
Jun 11, 2019 at 07:40
Ahli sejak Jul 24, 2018
108 hantaran
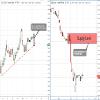
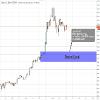
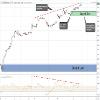
Last week’s candle on USD/CAD has ended with an engulfing candlestick pattern.
This weekly candlestick is red from the beginning to the end.
After the price compressed vertically and took all the buyer’s orders on the way up. It dropped back to the origin of the compression.
This drop created last week’s candlestick which engulfed the previous 12 candlesticks.
However, the price still does not break the uptrend support line on the weekly chart.
Still, we are unable to say that the momentum has changed. If the price does break the uptrend support line, then we can say that the long term momentum has changed from bullish to bearish.
In this case, I’ll wait for the price to retrace the supply above and sell there. If the price does not break the uptrend support line, then the supply above will be too risky for sell position since the momentum remains bullish.
We fund the top 5% forex traders
Ahli sejak Jul 24, 2018
108 hantaran
Jun 17, 2019 at 06:13
Ahli sejak Jul 24, 2018
108 hantaran
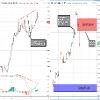
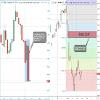
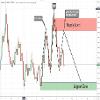
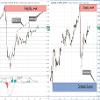
MACD Divergence With A New Supply For Sell Position On XAU/USD.
There are a few reasons to look for a sell position in XAU/USD:
1. In the wide picture – 1W chart, the price has just arrived into a strong resistance zone. The last time that this happened was about a year and a half ago but back then, it continued to drop to 1160.00 zones.
2. In the 4H chart, there is a remarkable divergence between the MACD indicator and the price. While the price creates a higher high, the MACD creates a lower high and that divergence indicates that the recent uptrend is now powerless.
3. In the 1H chart, there is a new supply above. The last demand of the recent uptrend has broken out by this supply. This indicates that the supply is a strong one and is also on the right level to open a sell position, only if the price retraces there.
The demand below will be the final destination for this sell position.
We fund the top 5% forex traders
Ahli sejak Jul 24, 2018
108 hantaran
Jun 18, 2019 at 10:46
Ahli sejak Jul 24, 2018
108 hantaran
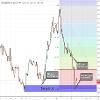
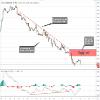
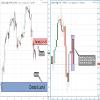
Combination Of Fibonacci 38.2% And Fresh Supply.
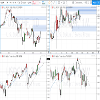
We can see that on the 4H, 1D, 1W and even 1M charts that, in the long term, the NZD/USD pair is in bearish momentum. At the moment, we can also see on the 4H chart that the price has just arrived at the demand level that was created about a month ago.
Two and a half weeks ago and for the first time, the price checked for this demand and picked up some unfilled buy orders from there. Then it moved up about 170 pips and dropped back down to the demand level.
But now, the price is digging deeper into that demand and we can see by the big red candles that the price has returned with more power than the first time. This indicates a high probability of breaking out the demand this time.
Fibonacci levels are significant in trading the forex market and a combination of supply level with Fibonacci 38.2% is a great setup for the sell position.
Usually, the combination of supply and Fibonacci 38.2% is a very reliable setup. If the price is able to retrace to this level, it will be a great opportunity for a sell position at the first touch.
The first target will be at 0.6500 zones and the final target is at 0.6300 which is a support zone that we can see on a 1W chart.
We fund the top 5% forex traders
Ahli sejak Jul 24, 2018
108 hantaran
Jun 24, 2019 at 11:28
Ahli sejak Jul 24, 2018
108 hantaran
Quasimodo Level after MACD Divergence and Pinbar Pattern in GBP/JPY
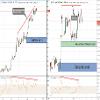
Today, this GBP/JPY pair is in a downtrend of almost 1000 pips and is still considered bearish.
Yesterday’s 1D chart, the candle has ended as a Pinbar pattern. The Pinbar candlestick pattern is a reversal pattern and is a very reliable pattern to use amongst forex traders.
In this 1D chart, there is a bullish Pinbar which shows us the first signal for a reversal opportunity.
There is also a MACD Divergence price formation. If the price creates a lower low, then the MACD creates a higher low. This indicates that the downtrend is decreasing its strength, and now gives us the second signal for reversal opportunity. This is at least for the short term.
In the 1H chart, below, there is a third signal, which is a new demand, and it is a Quasimodo level which is considered to be a very powerful level.
The confluence of these three signals, the Pinbar pattern, MACD divergence, and the Quasimodo level, all create a reliable opportunity for a reversal position.
The right level to open buy position is the demand below, which is the Quasimodo level, and of course only, if the price retraces to that level.
The first target for this position is number 1, the supply above. The final target will be number 2, the supply at the top.
We fund the top 5% forex traders
Ahli sejak Jul 24, 2018
108 hantaran
Jun 25, 2019 at 13:54
Ahli sejak Jul 24, 2018
108 hantaran
Bitcoin is Re-born and Continues to Race Towards New Highs with Facebook LIBRA’s Reveal
As predicted in our previous post about BTC/USD, the price remains bullish. However, the buyers are on the dominant side here because of the launching of Facebook’s LIBRA. LIBRA brings new hope for cryptocurrencies to be raised.
The last rally happened due to the giant, social media Facebook, revealing the details of its cryptocurrency LIBRA. Some of the excitement about LIBRA is that it allows people to purchase things and send money with almost zero fees.
The main difference between LIBRA and the other cryptocurrencies is that official financial organizations, such as MasterCard, Visa, and PayPal are supporting LIBRA. The fact that leading Financial Corporates are expressing trust in this or any Cryptocurrency Project affects all the other cryptocurrency markets. Hence, the main reason for the last rally in the BTC/USD price.
If we look at the 1W chart, it shows that in the long term the price is on its way to reaching the $20,000 zone. We predicted this in our previous BTC/USD post.
Below, there is a fresh (untested) demand level, as marked on the 1H chart. This fresh demand seems like an excellent level to buy at and to join the bullish momentum. If the price retraces that level, we can look for another confirmation as a MACD Divergence or maybe a Candlestick pattern in the lower time frames (15M or 5M). A confluence between the demand and one of these two will be a very reliable setup for buy position.
The long term target remains a historical record of the BTC/USD price, which is at $19,500.
We fund the top 5% forex traders
Ahli sejak Jul 24, 2018
108 hantaran
Jul 01, 2019 at 10:10
Ahli sejak Jul 24, 2018
108 hantaran
A confluence of Fresh Supply and Fibonacci 61.8% in USD/CHF.
Two weeks ago, seen in the W1 chart, the USD/CHF weekly candle had ended as a bearish engulfing pattern. The big red candlestick shows this bearish engulfment.
This pattern was a continuation outside bar candlestick pattern. It shows how the big red candle engulfed the one before and it also shows how significant the strength and determination of the bears were with the USD/CHF price.
Referring to the 1W or 1M charts, technically, the USD/CHF is bearish. and if we would like to sit with the dominant side, then we should look for a sell position.
In the 4H chart, we can see a very reliable setup for a sell position. A confluence of fresh supply and Fibonacci 61.8% of the recent downtrend.
In addition, on the 1W chart, we have a bearish outside bar pattern, that pattern with the confluence of fresh supply and Fibonacci 61.8% gives us enough signals to look for a sell position.
We fund the top 5% forex traders
Ahli sejak Jul 24, 2018
108 hantaran
Jul 05, 2019 at 07:22
Ahli sejak Jul 24, 2018
108 hantaran
Too Risky to Sell EUR/CAD with this Supply Above?
At any time frame, the EUR/CAD seems to be in bearish momentum.
In the H1 chart, the price is in a downtrend of almost 300 pips. While yesterday a fresh supply was created by the price above.
Most of this downtrend was a compression which meant that the price compressed down while picking up all the sell orders along the way.
Compression indicates a powerless movement in the price. In other words, it seems the last downtrend of the price was powerless and it’s safer to look for a reversal signal and trade against the compression.
Usually, a supply level is a great level for a sell position, but this supply is created after the price had already decreased about 250 pips and divergence has occurred between the MACD indicator and the price.
So, instead, I will use this supply as a confirmation zone and not as a level of sell position to sell this supply as is too risky now.
If the price will break out the supply, it will be a signal for reversal opportunity and we should look for a price action setup for a buy position.
Breaking out the supply above will change the momentum in the H1 chart from bearish to bullish.
We fund the top 5% forex traders
Ahli sejak Jul 24, 2018
108 hantaran
Jul 13, 2019 at 09:18
Ahli sejak Jul 24, 2018
108 hantaran
A Confluence Between Head & Shoulders and CCI Divergence
If we look at the long term charts (D1 or W1) we will see the EUR/AUD is in bullish momentum.
The recent technical correction which starts about three weeks ago created a Head and Shoulders pattern.
Head and Shoulders pattern that came after a long trend usually indicates a reversal opportunity.
At the moment, the price supporting by support zone which is also the Head and Shoulders’ neckline.
In the D1 chart, we can also see a significant between the price and the CCI indicator which indicates a
weakness at the end of the recent uptrend.
Also, we can see that the right side of the pattern, which are the sellers, is more powerful, the red Candles are bigger and seems more aggressive.
For now, we should wait and see if the price will breakout the support which is the neckline.
If that happened, the next step is to look for a price action setup for a sell position.
The first target will be the support 2, and the final target will be the demand at the bottom.
We fund the top 5% forex traders
Ahli sejak Jul 24, 2018
108 hantaran
Jul 14, 2019 at 12:31
Ahli sejak Jul 24, 2018
108 hantaran
After SPX500 Reach New High Record, What are The Signals For Reversal Opportunity?
last week ended with new high records for the US indexes.
The main reason for the stock market to keep rising up is the high expectations for an interest-rate cut from the Federal Reserve.
these expectations came after Federal Reserve Chairman Jerome Powell testified before the Congress.
Usually, when the price is in a new high record it’s the time to look for a reversal signal.
If we look in H1 chart on the SPX500, we can see a significant divergence between the price and the CCI indicator.
The CCI divergence indicates that the uptrend becomes powerless.
Combining two signals together is always a safer way to trade, so in addition to the CCI divergence, we should wait to see if the price will breakout the support below.
If that happens, we can start looking for price action setup of a sell position.
If this prediction will come true, the target for this sell position will be the demand at the bottom.
We fund the top 5% forex traders
Ahli sejak Jul 24, 2018
108 hantaran
Jul 17, 2019 at 12:05
Ahli sejak Jul 24, 2018
108 hantaran
Influence of Supply and Head and Shoulders Potential
Wednesday 17/07/2019
The Head and Shoulders pattern consider as one of the most reliable reversal patterns in forex trading.
This chart formation of Head and Shoulders have a baseline of three peaks,
The middle one which is the Head is the highest one,
And the other outside two which are the Shoulders are usually about the same height.
If we look at the D1 chart, we can see the EUR/USD price has great potential to complete the Head and Shoulders pattern.
The price already creates the left shoulder and the head,
Now, we wait to see if the price will complete the right shoulder.
If the price will rise up and reach the same high as the left shoulder it will be the moment to open a sell position.
The main reason to sell there is not that the price reaches the same height as the left shoulder,
It is because it’s also a fresh supply level.
So, if the price reaches that supply and drops from there it will complete the right shoulder,
And, therefore, the all Head and Shoulders pattern completed and we succeed to predict it one step before most of the traders.
The first target will be the support below.
The final target will be 1.0650 zones which is a great demand that we can see on the W1 chart.
Also, in the long term, the momentum is bearish, it always better to trade with the momentum.
We fund the top 5% forex traders
Ahli sejak Jul 24, 2018
108 hantaran
Jul 22, 2019 at 09:30
Ahli sejak Jul 24, 2018
108 hantaran
Despite The “Ships War” in Strait of Hormuz, USOIL Keep Falling Down
Monday 22/07/2019
In the W1 chart on USOIL, the last candlestick ended as a bearish engulfing candlestick which engulfed the three previous bullish candles.
We can see how the big red candle on the picture closed below the low of the three previous bullish candles.
That bearish Engulf Candlestick is a signal to look for a sell position on USOIL.
In the H4 chart, we can see the fresh supply above at 56.60 zones.
This fresh supply can be a great continuation level for a sell position.
If the price retraces the fresh supply above we can sell there.
The target for this sell position will be the demand below which also a great level for buy position.
A few days ago, Iran seizes a British ship in the Strait of Hormuz.
The situation between Iran and western countries is very explosive these days.
If the relationship between Iran and western countries will keep roll down it can really lead to war.
So, although the fresh supply above and the engulfing bearish candlestick, we should be really careful while selling USOIL.
If the relationship will roll down between Iran and western countries, the USOIL price might fly up and all this technical analysis will become irrelevant.
We fund the top 5% forex traders
Ahli sejak Jul 24, 2018
108 hantaran
Jul 24, 2019 at 13:22
Ahli sejak Jul 24, 2018
108 hantaran
A Confluence of Bullish Outside Bar Candlestick Pattern and a Significant Support Zone
Wednesday 24/07/2019
GBP/USD has formed a bullish outside bar candlestick pattern in the H4 time frame.
We can see in the H4 chart how the last big green candle in the picture attached engulfed the previous four candles and closed at the highest.
If we look at the high time frames charts (W1 or D1), we can see that the price is bearish in the last one and a half years, since April 2018.
At the moment, the price just arrived into the support zone which originally was a demand that formed in April 2017.
The confluence of the bullish outside bar candlestick pattern and the significant support is a very powerful one.
It creates a great opportunity for buy position.
Below, there is a fresh demand created earlier today.
If the price retraces this demand, it will be the right time to open a buy position for GBP/USD.
The resistance above will be the first target for this position.
The source of this resistance is a supply level which formed on 04/07/2019.
After the price tested this supply three times it became a resistance zone.
The final target for this trade will be the fresh supply at the top.
The supply at the top is a very significant one, if the price will break this supply it means that the long term momentum has changed from bearish to bullish.
We fund the top 5% forex traders
Ahli sejak Jul 24, 2018
108 hantaran
Jul 30, 2019 at 13:08
Ahli sejak Jul 24, 2018
108 hantaran
Which Level will the Price Hit First- Supply or Demand?
Tuesday 30/07/2019
As we can see in the H4 time frame, the USD/JPY price is just between significant supply and demand (also pivot points).
These supply and demand also confluence with the daily pivot points.
They are price levels used by forex traders as significant levels in the price.
These levels are calculated as an average of prices from the performance of a market in the prior trading period.
Usually, pivot points function as support resistance zones.
In that case, we can see a great confluence between the pivot points and a fresh supply and demand.
The pivot points in the picture are daily points and relevant for today only.
For now, it seems the price is in bullish momentum, therefore, to look for a buy position is safer.
The demand below can be a great level for the buy position since it also confluence with daily S2 level
The target, in that case, will be the supply above.
The supply above is also a great level for the sell position since it confluence with the daily R3 level.
The target for the sell position will be the demand below.
We fund the top 5% forex traders
Ahli sejak Jul 24, 2018
108 hantaran
Aug 04, 2019 at 12:17
Ahli sejak Jul 24, 2018
108 hantaran
Is The Trade War Between USA and China Back on?
Sunday 04/08/2019
The last week’s candlestick for the SPX500 index has ended as a bearish reversal engulfing candlestick pattern.
The big red candle of the last week engulfed the previous four weekly candles and closed below these four candle’s low.
It seems like it’s the implications of Donald Trump’s latest remarks about tariffs.
A few weeks ago, in one of our previous posts on SPX500, it was good news for the stock market after the meeting between Trump and Xi Jinping.
Trump tweets: “Things look very good” and the markets rise up.
A few days ago things sound different as Trump announced on an additional 10% tariff rate for all Chinese goods.
Now, eyes focus on Beijing to see how they will react to the latest escalation.
Technically, the bearish reversal engulfing candlestick creates a signal and opportunity for sell position on SPX500.
In the H1 time frame, we can see how the market opens Friday with a Gap down.
This Gap down is also a fresh supply as the price dropped from there.
If the price will close that Gap and touch the supply above it will be great timing to open a sell position.
The final target for the sell position will be the demand below that marked on the W1 picture.
This demand is also a potential level for buy position.
We can how this demand creates 8 weeks ago a bullish outside bar candlestick pattern.
We fund the top 5% forex traders
Ahli sejak Jul 24, 2018
108 hantaran
Aug 18, 2019 at 12:58
Ahli sejak Jul 24, 2018
108 hantaran
A Confluence of MACD Divergence and Fresh Demand.
Sunday 18/08/2019
Although the interest rate cut, it seems that the Greenback is back to be bullish.
Also, it seems that the Greenback gets strong against most of the other currencies.
In D1 chart, we can see a bullish outside bar candlestick pattern which is a strong reversal candle.
The daily candle from the 13/08 engulfed the two previous candles, it’s a big green candlestick.
We can see also that the close price of this candle is also the high of it, which indicates the determination of the buyers on this day.
In the H1 chart, we can see the right level to buy the Greenback against the CHF which is the fresh demand below.
This demand created the daily outside bar candlestick pattern.
This confluence between MACD divergence and a fresh demand creates a very reliable setup for buy position.
In the H1 chart, we can see also a divergence between the MACD indicator and the price.
While the price creates a higher high the MACD creates a lower high.
This divergence may indicate the price on it’s way to a technical correction before Greenback continues it’s way up.
This technical correction can drop the price to the demand below, if that happened we should buy there.
The target for this buy position will be the supply above which we can see on the D1 chart.
We fund the top 5% forex traders
Ahli sejak Jul 24, 2018
108 hantaran
Aug 22, 2019 at 12:42
Ahli sejak Jul 24, 2018
108 hantaran
BTC/USD is Back Into the Bearish Zone After Breakout the Demand.
Thursday 22/08/2019
A fresh supply which created on the 20/08 has succeeded to breakout the demand from 19/08.
This situation turns back the BTC/USD price into the bearish momentum.
In our previous post on BTC/USD, we marked this demand as a great level for buy position.
The fact that the fresh supply breakout this powerful demand indicates the determination of the sellers.
For now, there is two fresh supply above and each one of them is a potential level for sell position.
Each one of them also has a great confluence with Fibonacci retracement levels.
We can see this confluence in the H2 time frame chart.
That confluence creates a reliable setup for sell position.
If the price reaches supply 1 which is also 38.2% Fibonacci level I’ll sell there and the stop loss will be just above the supply level marked in red.
In case the price will breakout the supply 1 and hit the stop loss we can sell again at supply 2 which also 61.8% Fibonacci level.
Each one of these supply has a great Risk Reward potential.
In both cases, the first target will be the support below which we can see in the H4 chart.
And the final target will the demand at the bottom which also can see in the H4 chart.
The demand at the bottom can be also a great level for open buy position on BTC/USD.
We fund the top 5% forex traders
Ahli sejak Jul 24, 2018
108 hantaran
Aug 28, 2019 at 12:03
Ahli sejak Jul 24, 2018
108 hantaran
USDCHF compressed up toward the fresh supply above.
Price compressed toward supply is a great price action setup.
In addition, there is also a clear MACD divergence which makes this level even more reliable for sell position.
Price compressed toward supply is a great price action setup.
In addition, there is also a clear MACD divergence which makes this level even more reliable for sell position.
We fund the top 5% forex traders
Ahli sejak Aug 31, 2019
2 hantaran
Aug 31, 2019 at 15:59
Ahli sejak Aug 31, 2019
2 hantaran
The5ers1 posted:
USDCHF compressed up toward the fresh supply above.
Price compressed toward supply is a great price action setup.
In addition, there is also a clear MACD divergence which makes this level even more reliable for sell position.
This is my analysis on USDCHF if you trade the higher time frames.
superswingtradr
Ahli sejak Jul 24, 2018
108 hantaran
Sep 05, 2019 at 13:10
Ahli sejak Jul 24, 2018
108 hantaran
A Technical Correction or Momentum Shift?
Thursday 05/09/2019
In the long term, the XAU/USD is bullish but now performed a double top.
The price now is at a 6.5 years high, last time the price was in these zones was in April 2013.
In the D1 time frame chart, we can see the nice rally the price performed.
We can see also a significant CCI divergence, while the price creates a higher high the CCI creates a lower high.
This divergence indicates that buyers start to lose power.
In the H4 time frame chart, we can see how the price starts to perform a double top which also indicates powerless buyers.
The price still hasn’t completed the double top pattern,
It will be completed only if the price will breakout the support below which is the confirmation zone.
In addition to theses 2 signals, if we look at the W1 chart we will see the price reach a significant supply from April 2013.
It is the first time the price touch this zone since then.
So, we have a CCI divergence in the D1 chart, double top in H4 chart, and significant supply in the W1 chart.
The confluence of all these signals creates a very reliable setup to look for a sell position.
Now, I’ll wait to see if the price will breakout the support below and complete the double top pattern.
If that happens I’ll look for price action setup for sell position.
The first target will be the demand below on the H4 chart and the final target will the demand I marked on the D1 chart.
BTW, if the price will break through the demand in the H4 chart it indicates that the long term momentum has changed to bearish.
As long as the price didn’t break the demand in the H4 chart it considers as a technical correction.
We fund the top 5% forex traders

*Penggunaan komersil dan spam tidak akan diterima, dan boleh mengakibatkan penamatan akaun.
Petua: Menyiarkan url gambar/youtube akan menyisipkannya secara automatik dalam siaran hantaran anda!
Tip: Taipkan tanda @ untuk melengkapkan nama pengguna yang menyertai perbincangan ini secara automatik.


