Edit Your Comment
Chart Of The Day From HTG
Tham gia từ Nov 04, 2015
15bài viết
Nov 14, 2015 at 13:45
(đã sửa Nov 13, 2015 at 12:51)
Tham gia từ Nov 04, 2015
15bài viết
Pair is trading in decision point. Yesterday's AUS Employment change report given a fuel in Asia session and pair traded higher towards .7150 but till NY open pair consume all fuel and traded most of it's gain.
Pair is testing few important technical levels. It's trading in bearish channel and testing the upper channel.
It's also testing daily bullish trendline. Daily close below it, will boost bearish view and can see below .6900 level.
It's testing 240min 100 SMA.
Pair is testing few important technical levels. It's trading in bearish channel and testing the upper channel.
It's also testing daily bullish trendline. Daily close below it, will boost bearish view and can see below .6900 level.
It's testing 240min 100 SMA.
Tham gia từ Nov 04, 2015
15bài viết
Nov 22, 2015 at 13:41
Tham gia từ Nov 04, 2015
15bài viết
We are tracking this pair for long time and still believe that correction is due to retrace previous down-trend. In small time frame, we are expecting current move is a flat correction while one more leg up required to mark correction complete.
We are waiting for that to complete before imitating any new short positions. However, there are high portability trade present for long.
We are waiting for that to complete before imitating any new short positions. However, there are high portability trade present for long.
Tham gia từ Nov 04, 2015
15bài viết
Nov 22, 2015 at 13:41
Tham gia từ Nov 04, 2015
15bài viết
This is really interesting pair. We are bearish on technical and fundamental front. BOE are looking for rate hike while RBNZ are about to cut interest rate anytime.
For Elliott wave, we might seen the correction complete and a new bearish trend is in the control. We are looking to see on any 3 wave correction with high risk:reward.
For Elliott wave, we might seen the correction complete and a new bearish trend is in the control. We are looking to see on any 3 wave correction with high risk:reward.
Tham gia từ Nov 04, 2015
15bài viết
Nov 25, 2015 at 12:02
Tham gia từ Nov 04, 2015
15bài viết
It's on decision point. Either break or make. It also having nice long opportunity present with today's low for targeting 1.35.
We are still expecting another leg is due before having any reversal. More specific, we are expecting leg can be extended for 1.36. Daily close below trendline will give signal of reversal. This trade will have Good Risk:Reward having.
We are still expecting another leg is due before having any reversal. More specific, we are expecting leg can be extended for 1.36. Daily close below trendline will give signal of reversal. This trade will have Good Risk:Reward having.
Tham gia từ Nov 04, 2015
15bài viết
Nov 30, 2015 at 07:55
Tham gia từ Nov 04, 2015
15bài viết
Talking Points:
- GBPNZD Technical Strategy: Temporary Bearish
- Elliottwave Count: Flat Correction for wave
- Upcoming major events: JPY-Retail Sales (YoY) (Oct), CAD-GDP (MoM) (Sep)
We are holding bullish long term count. We confirmed our last week pattern is not hold good and need to revisit whole counts. We now expecting another leg down towards 90 before turning bullish to complete pattern.
On weekly and 240 min chart, we had a confirmed channel breakout. We possibly look for short entry than a long entry to mine some profit out of this pair. But at this stage, we need to wait for some sort of retracement before entering into a trade.
Tham gia từ Nov 04, 2015
15bài viết
Jan 26, 2016 at 07:00
Tham gia từ Nov 04, 2015
15bài viết
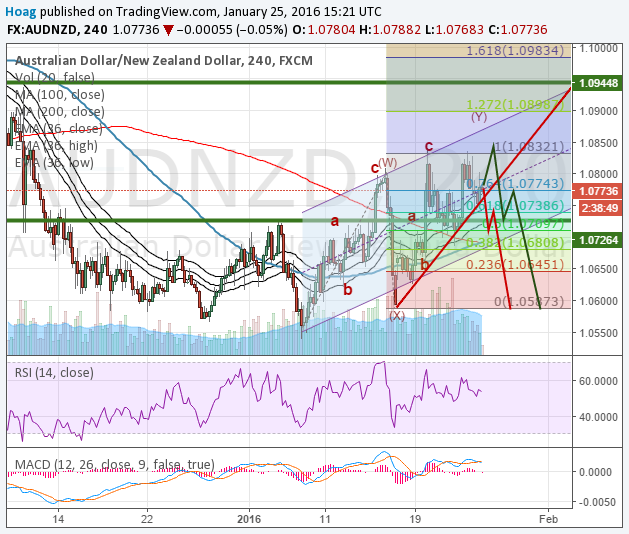
Talking Points:
- AUDNZD Technical Strategy: Bearish
- Elliottwave Count: Current move is consolidation and be part of wave y
This pair can play either of below scenario:
Scenario 1: In scenario 1, pair need to push one more high towards 1.0875 before continue it's down trend and can be complete it's wave c of wave y. This level also a 61.8 fibbo retracement level from previous down trend.
Scenario 2: With this scenario, we are looking to mark correction complete, because most of the criteria is accomplished to mark correction complete. So we prefer to be on scenario 2, but still not avoiding scenario 1 to get better risk:reward ratio, we want to be on sideline before initiate any trade.

Tham gia từ Nov 04, 2015
15bài viết
Jan 27, 2016 at 09:00
Tham gia từ Nov 04, 2015
15bài viết
Title: AUDNZD Elliottwave Technical Analysis: Looking for re-enter short on higher price
Talking Points:
AUDNZD Technical Strategy: Bearish
Elliottwave Count: Current move is consolidation and be part of wave y
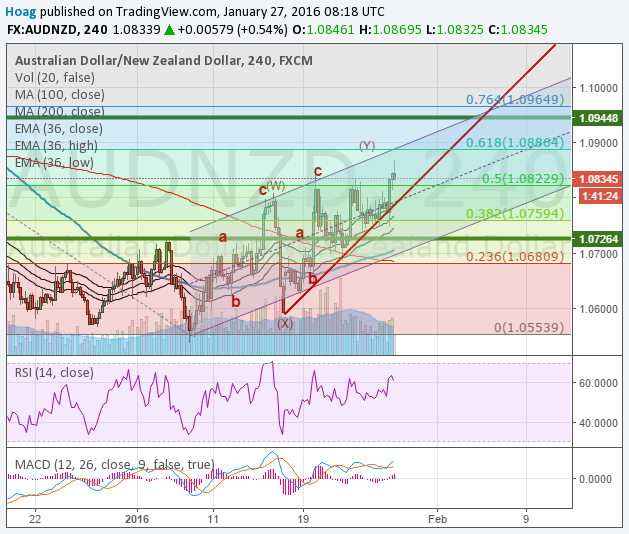
This pair is playing scenario 2 from our previous analysis. Considering this face, we will watching price action. Price can trade higher 1.088 to 1.09 before reversal hinted. We also should note that, 1.08860 is 61.8% fibbo zone and current upward price action is not a implusive in nature. Considering all indicators and wave count, we will be waiting to see reaction on 1.088 area.

Tham gia từ Nov 04, 2015
15bài viết
Mar 08, 2016 at 07:52
Tham gia từ Nov 04, 2015
15bài viết
Talking Points:
AUDUSD Technical Strategy: Temporary Bearish
Elliottwave Count: Primary count suggest wave Y in medium cycle while on alternate count suggest trend changed and we are in third wave
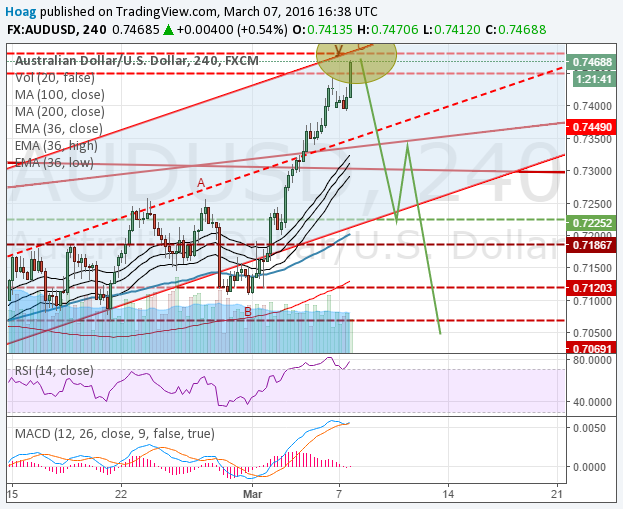
We are tracking this count from a while and initiated short @ 7250 which was stopped out and closed manually @ 7300 levels. After had a bearish trendline breakout on weekly chart, we are looking to see higher levels. But in short term and near future, we are expecting pull back.
Region marked in a chart ranging from 7470-7490 is a potential zone from which retracement can happen. Breakout of 7500 and above level will have bullish count and suggest major recovery.

Tham gia từ Nov 04, 2015
15bài viết
May 03, 2016 at 06:43
Tham gia từ Nov 04, 2015
15bài viết
Talking Points:
--------------------
GBPUSD Technical Strategy: Keeping Bearish view
Elliottwave Count: ZigZag Correction will be our primary choice in count
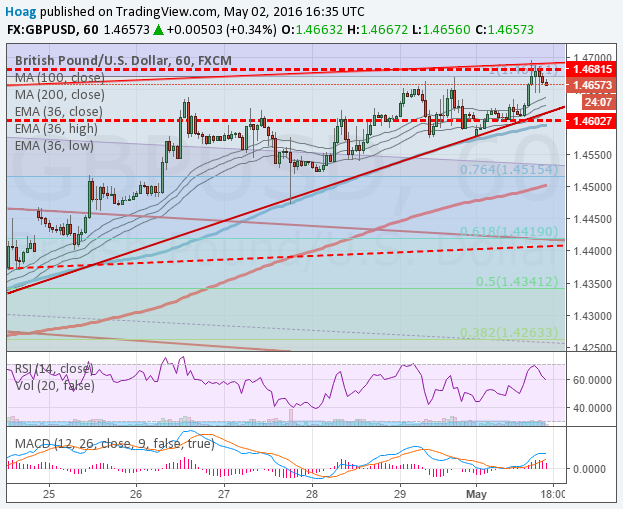
GBPUSD Start showing divergence on daily bearish trenline and 240min newly created bullish trendline. Current level 1.4650-1.4700 is 100% expansion of zigzag and also testing horizontal resistance.
Long term trend is down and don't see any reason to see bullish count but consider upward move from 1.3850 to 1.4750 is a pair of zigzag correction.

Tham gia từ Nov 04, 2015
15bài viết
May 16, 2016 at 06:54
Tham gia từ Nov 04, 2015
15bài viết
Blog Title: DXY Technical Analysis: Confirm Bullish view
--------------------------------------------------------------------------
Talking Points:
--------------------
[*]DXY Technical Strategy: Bullish
[*]Elliottwave Count: We are confirming flat correction here, and looking for impulse count
Analysis:
------------
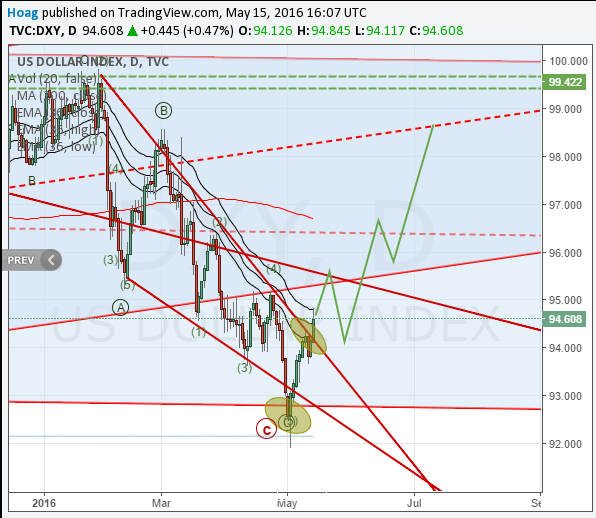
We keeping our primary analysis posted earlier month and considering correction over in dollar index. With that we are looking for gathering more evidence for bullish impulse count. First confirmation received after weekly close above flat correction channel. Followed by bearish triangle trend-line, which confirm that dollar indices is in bullish trend and will continue near future. Same was confirmed in EURUSD and other dollar basket currency pairs.
What to do:
----------------
We started buying dollar index and dollar basket pairs and will add more in retracements. We will already in short EURUSD, GBPUSD.

*Nghiêm cấm sử dụng cho mục đích thương mại và spam, nếu vi phạm có thể dẫn đến việc chấm dứt tài khoản.
Mẹo: Đăng ảnh/url youtube sẽ tự động được nhúng vào bài viết của bạn!
Mẹo: Dùng @ để tự động điền tên người dùng tham gia vào cuộc thảo luận này.


