


E-Onz (による Roboforex)
そのユーザーはこのシステムを削除しました。
E-Onz 討論

Nov 25, 2015 at 08:33
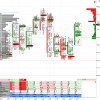
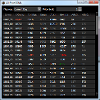
Starting from late 2009, you almost never see the real size of the executed orders in the ordinary NinjaTrader tape (Time and Sales). Almost every (especially large) market order is broken into pieces. For example, a 100 lots market order can be displayed in your ordinary tape in 100 individual prints. Since 2009 tape reading became very complicated, making conventional tape much less useful. But it doesn’t have to be this way!
Our version of tape (Smart Tape), combines individual prints back together (the way it used to be before 2009) so that you can easily see the actual market orders to their full extent. There are also filters available in the Smart Tape so you easily sense what the bigger/smaller traders are doing at the moment.
Also the Smart Tape is capable of displaying some other essential information including Iceberg Orders, and much more.
付属品:
Nov 26, 2015 at 07:42
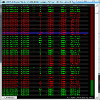
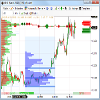
All calculations are similar to those we use in our Smart Tape, but info gets displayed in the form of clusters. This innovative approach makes it easier to embrace all the info (same info you see in the Smart Tape) in a form of a Tick Cluster chart. It allows you to see market orders executed with slippage. Also on a Tick Cluster chart you can see distribution of the current day volumes and Level II (DOM) data.
付属品:
Nov 30, 2015 at 09:27
(編集済みのNov 30, 2015 at 09:28)
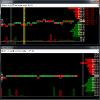
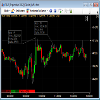
This innovative tool designed to spot and analize activity of high friquency algorithms – HFTs.
It allows you:
To highlight large orders
To see Iceberg (DND – Do Not Display) orders
To spot activities of spoofing algorithmes
Spoofing algos mostly designed to mislead you. For example a spoofing algo makes an order visible in the DOM for 9/10 of a second then within 1/10 of a second removes it from the DOM and puts it back on. It’s difficult for human eyes to sense these changes, therefore, it creates an impression of a big order
付属品:

forex_trader_271176
Aug 27, 2015からメンバー
68 投稿
Jan 04, 2016 at 08:51
Highly suspicious! The owner doesn't even have confidence in his EA by using it in his real account


