Edit Your Comment
FxNews—Forex Technical Analysis
Miembro desde Sep 27, 2024
posts 45
Oct 28, 2024 at 10:37
Miembro desde Sep 27, 2024
posts 45
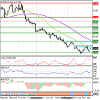
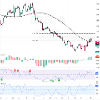
EUR/USD Set to Drop as Bearish Pattern Forms
FxNews—The EUR/USD currency pair formed a bearish engulfing pattern close to the 50-period simple moving average. Meanwhile, the immediate support rests at $1.078. From a technical perspective, the downtrend will likely resume, with the next target at $1.072 if bears stabilize the price below the immediate support.
Furthermore, the bearish outlook should be invalidated if the EUR/USD price exceeds the critical resistance level of $1.088.
Knowledge Should Be Free – And So Is Your Path to Trading Success.
Miembro desde Sep 27, 2024
posts 45
Oct 29, 2024 at 09:25
Miembro desde Sep 27, 2024
posts 45
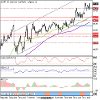
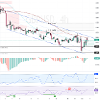
GBP/JPY Signals Strength Above Key Support Levels
FxNews—GBP/JPY bounced from the 198.3 Fair Value Gap area, which is a strong bullish signal, considering the primary trend is bullish with the price being above the 50- and 100-period simple moving averages.
The momentum indicators are not overbought, and the Awesome Oscillator histogram turned green, suggesting the uptrend should resume.
Critical support that divided the bull market from the bear market stands at 196.6, backed by the 50-period simple moving average. As long as the price holds above the 196.6 mark, the outlook for the GBP/JPY currency pair remains bullish.
In this scenario, the next target will likely be the 201.0 mark.
Knowledge Should Be Free – And So Is Your Path to Trading Success.
Miembro desde Sep 27, 2024
posts 45
Oct 30, 2024 at 16:56
Miembro desde Sep 27, 2024
posts 45
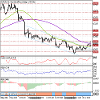
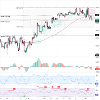
GBP/USD Tests Key Resistance: Will It Break or Retreat?
FxNews—The GBP/USD currency pair broke above the descending trendline, testing the 100-period simple moving average as resistance.
Currently, the market is uncertain. The 4-hour chart formed a long wick bullish and bearish candlestick pattern one after another. Therefore, the next wave depends on whether the price exceeds the primary resistance at $1.304 or falls below the immediate support at $1.293.
On the bullish side, if GBP/USD closes above 1.304, which is backed by the 100-SMA, the consolidation phase has the potential to extend to the next resistance area at 1.311, followed by 1.315.
Conversely, the bearish trend will likely be triggered if bears push the price below the $1.293 support. If this scenario unfolds, the next target could be the $1.287 mark.
Knowledge Should Be Free – And So Is Your Path to Trading Success.
Miembro desde Sep 27, 2024
posts 45
Oct 31, 2024 at 10:17
Miembro desde Sep 27, 2024
posts 45
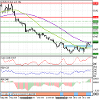
EUR/USD Tests Key Resistance Trading at 1.087
FxNews—The EUR/USD price trades at approximately 1.087, testing the October high as resistance, backed by the 100-period simple moving average.
Concurrently, the Stochastic Oscillator is overpriced, indicating that the Euro is overpriced in the short term. That being said, the Awesome Oscillator recently turned red, suggesting that the bear market is gaining more momentum.
Forecast
From a technical perspective, the downtrend should resume if the immediate resistance at 1.087 holds. In this scenario, EUR/USD is likely to revisit the October low at 1.076.
Please note that the bearish outlook should be invalidated if EUR/USD exceeds the 100-period SMA at 1.087. If this scenario unfolds, the rise from 1.076 could extend to 1.095.
Knowledge Should Be Free – And So Is Your Path to Trading Success.
Miembro desde Sep 27, 2024
posts 45
Nov 01, 2024 at 10:03
Miembro desde Sep 27, 2024
posts 45
Euro Faces Pressure: Key Indicators to Watch Now
FxNews—The EUR/USD currency pair stabilizes above the 100-period simple moving average and the 1.084 immediate support level. This occurs as Stochastic records show a reading of 82, indicating that the Euro is overpriced in the short term. Additionally, the Awesome Oscillator histogram is red, suggesting that the bear market is strengthening.
From a technical perspective, the bullish outlook remains valid as long as the price holds above the 1.085 support level. In this scenario, the next target could be the 38.2% Fibonacci retracement level at 1.093.
Please note that the bullish outlook should be considered invalid if the price dips below 1.084.
Knowledge Should Be Free – And So Is Your Path to Trading Success.
Miembro desde Sep 27, 2024
posts 45
Nov 04, 2024 at 12:23
Miembro desde Sep 27, 2024
posts 45
GBPUSD Bounces from 100-SMA as UK Inflation Nears 2.6%
The GBP/USD primary trend remains bearish as long as the price is below the 38.2% Fibonacci retracement level. If that level holds, the downtrend will likely resume. In this scenario, the GBP/USD pair could target 1.293, followed by 1.287.
The GBP/USD primary trend remains bearish as long as the price is below the 38.2% Fibonacci retracement level. If that level holds, the downtrend will likely resume. In this scenario, the GBP/USD pair could target 1.293, followed by 1.287.
Knowledge Should Be Free – And So Is Your Path to Trading Success.
Miembro desde Sep 27, 2024
posts 45
Nov 05, 2024 at 11:26
Miembro desde Sep 27, 2024
posts 45
USD/CHF FVG Bearish Gap Hints at Stronger Downtrend
FxNews—USD/CHF tested the 100-period simple moving average. Consequently, the 4-hour price chart formed a bearish fair value gap, indicating that the bear market is strengthening. Additionally, the AO histogram turned red, suggesting the downtrend should resume.
The immediate support rests at the November 4 low, the 0.861 mark. From a technical perspective, the downtrend should continue if USD/CHF closes below 0.861. In this scenario, the bearish trend will likely extend to the 23.6% Fibonacci support level at 0.857.
Please note that the bearish outlook will be invalidated if USD/CHF closes and stabilizes above the 0.865 immediate resistance.
Knowledge Should Be Free – And So Is Your Path to Trading Success.

*El uso comercial y el spam no serán tolerados y pueden resultar en el cierre de la cuenta.
Consejo: Al publicar una imagen o una URL de YouTube, ésta se integrará automáticamente en su mensaje!
Consejo: Escriba el signo @ para completar automáticamente un nombre de usuario que participa en esta discusión.


