USDCAD Chart
US Dollar vs Canadian Dollar Exchange Rate (USD to CAD)
+0.04% +6.1 pips
USDCAD Live Price Chart
Upcoming Events for USD and CAD
|
Event
|
Prev.
|
Cons.
|
|||
|---|---|---|---|---|---|
|
2h 59m
Med
|
CAD | 36% | |||
|
10h 29m
Low
|
USD | 3.75% | |||
|
10h 29m
Low
|
USD | 3.855% | |||
|
1d
Low
|
USD | 97.4 |
97.8
|
||
|
1d
High
|
USD | 15K | |||
|
1d
Low
|
USD | 8.7 | |||
|
1d
Low
|
USD |
5.179
|
|||
|
1d
High
|
USD | -2.4% |
-0.7%
|
||
|
1d
High
|
USD | 4.09M |
4.07M
|
||
|
1d
Low
|
USD | $18.8T |
FRB and BOC Interest Rates
| Country | Central Bank | Current Rate | Previous Rate | Next Meeting |
|---|---|---|---|---|
| United States | Federal Reserve | 3.75% | 3.75% | 37 days |
| Canada | Bank of Canada | 2.25% | 2.25% | 23 days |
Latest USDCAD News

U.S. Employment Unexpectedly Dips In July, Unemployment Rate Edges Lower

U.S. Employment Unexpectedly Dips By 23,000 Jobs In July

U.S. Wholesale Inventories Rise Slightly Less Than Expected In June

U.S. Labor Productivity Jumps Much More Than Expected In Q2
Analysis for USDCAD

Can USDCAD (4H) break free from its bearish grip?

Midweek Technical Look – AUDUSD, USDCAD, Nvidia

Oil Markets Stabilize as Hormuz Agreement Eases Supply Concerns | 6th August, 2026

Improving Risk Sentiment Lifts Currencies as Iran Peace Hopes Ease Market Fears | 3rd August, 2026
USDCAD Exchange Rates Analysis
USDCAD Historical Data - Historical USDCAD data selectable by date range and timeframe.
USDCAD Volatility - USDCAD real time currency volatility analysis.
USDCAD Correlation - USDCAD real time currency correlation analysis.
USDCAD Indicators - USDCAD real time indicators.
USDCAD Patterns - USDCAD real time price patterns.
USDCAD Technical Analysis
| Pattern | Buy (4) | Sell (10) |
|---|---|---|
| Belt-hold |
m5
|
m1, m15
|
| Closing Marubozu |
m1, m15
|
|
| Engulfing Pattern |
m15, h1
|
|
| Hammer |
m30, h1
|
|
| Long Line |
m1, m15
|
|
| Marubozu |
m1, m15
|
|
| Spinning Top |
w1
|
Live Spreads
| Brokers | USD/CAD |
|---|---|
 Open Account
|
- |
 Open Account
|
- |
 Open Account
|
- |
 Open Account
|
- |
 Open Account
|
- |
 Open Account
|
- |
 Open Account
|
- |
 Open Account
|
- |
 Open Account
|
- |
 Open Account
|
- |
Charts Activity
-
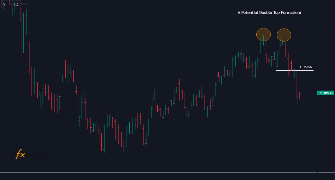
USDCAD,D1 by TheDailyFX Dec 10, 2025 at 10:58
-
USDCAD,H1 by Michealking101 Dec 08, 2025 at 12:08

-
USDCAD,M30 by naeem5678 Sep 08, 2025 at 07:34

-
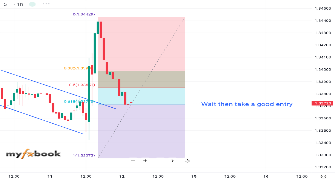
USDCAD,H1 by Baneleakababy Jan 11, 2024 at 11:03
-
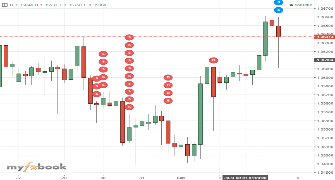
USDCAD,H4 by morrynet Aug 30, 2023 at 17:33
Heat Map
| 1 minute | |
| 5 minutes | |
| 15 minutes | |
| 30 minutes | |
| 1 hour | |
| 4 hours | |
| Daily | |
| Weekly | |
| Monthly |
What is USDCAD?
USDCAD is the exchange rate that shows how much 1 unit of US Dollar (USD) is worth in Canadian Dollar's (CAD).
Traders use USDCAD to speculate on price movements of US Dollar against the Canadian Dollar without owning the physical asset.
How much is 1 USDCAD today?
The current price of 1 USDCAD is 1.39527.
This price updates in real time based on market activity and liquidity across global trading sessions.
What is the Bid and Ask price for USDCAD?
- Bid price: 1.39527
- Ask price: 1.39466
The difference between them is known as the spread.
What is the daily range of USDCAD?
The daily trading range of USDCAD today is between 1.39409 and 1.39527.
This range reflects intraday volatility and helps traders assess potential risk and opportunity.
What is the sentiment of USDCAD?
You can check the current market sentiment for USDCAD, including long vs short positions from traders worldwide, on Myfxbook USDCAD Forex Sentiment.
What is the pip size for USDCAD?
The pip size for USDCAD is 0.0001.
Pip size is defined by the instrument’s price format and may vary between currencies, metals, and other markets.
How do I calculate position size for USDCAD?
You can easily calculate the correct position size for USDCAD based on your account size and risk percentage using Myfxbook’s position size calculator.
How do I calculate profit or loss for USDCAD trades?
To estimate potential profit or loss for a USDCAD trade, use the Myfxbook Profit Calculator.
What factors affect the price of USDCAD?
The price of USDCAD is influenced by a combination of market and economic factors, including:
- Supply and demand for the underlying assets
- Macroeconomic data and economic indicators
- Central bank policies and interest rate decisions
- Market sentiment and risk appetite
- Geopolitical developments and global events
- Major economic releases and central bank communications can increase volatility